Opsview Monitor vs. Retrace
Opsview Monitor vs. Retrace
| Product | Rating | Most Used By | Product Summary | Starting Price |
|---|---|---|---|---|
 Opsview Monitor | N/A | Opsview Monitor is an IT infrastructure and application monitoring solution. It monitors the infrastructure, applications, and endpoints of a network, and supports add-ons for automation and data exporting. Opsview also offers a free version of Monitor. | N/A | |
 Retrace | N/A | Retrace (formerly APM+) is a lightweight Application Performance Management solution. Retrace gives developers continuous, real-time analysis through a combination of code-level visibility with in-line log and error data. Retrace helps identify top performance offenders by analyzing top page requests, top SQL queries, and top external web services. | $99 up to 3 servers, 500,000 traces, and 1,000,000 logs |
| Opsview Monitor | Retrace | |||||||||||||||
|---|---|---|---|---|---|---|---|---|---|---|---|---|---|---|---|---|
| Editions & Modules | No answers on this topic |
| ||||||||||||||
| Offerings |
| |||||||||||||||
| Entry-level Setup Fee | Optional | No setup fee | ||||||||||||||
| Additional Details | — | Pricing is based on trace and log usage. | ||||||||||||||
| More Pricing Information | ||||||||||||||||
| Opsview Monitor | Retrace | |
|---|---|---|
| Top Pros | ||
| Top Cons |
|
|
| Opsview Monitor | Retrace | |
|---|---|---|
| Small Businesses |  Auvik Score 8.4 out of 10 |  InfluxDB Score 8.5 out of 10 |
| Medium-sized Companies |  IBM Instana Score 8.9 out of 10 | IBM Instana Score 8.9 out of 10 |
| Enterprises | IBM Instana Score 8.9 out of 10 | IBM Instana Score 8.9 out of 10 |
| All Alternatives | View all alternatives | View all alternatives |
| Opsview Monitor | Retrace | |
|---|---|---|
| Likelihood to Recommend | 9.0 (2 ratings) | 8.0 (2 ratings) |
| Opsview Monitor | Retrace | |
|---|---|---|
| Likelihood to Recommend |  Opsview
|  Stackify
|
| Pros | Opsview
| Stackify
|
| Cons | Opsview
| Stackify
|
| Alternatives Considered | Opsview
| Stackify
|
| Return on Investment | Opsview
| Stackify
|
| ScreenShots | Opsview Monitor Screenshots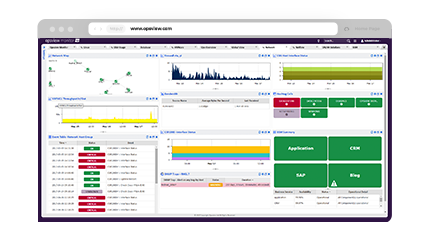 | Retrace Screenshots      |