TrustRadius
LogicMonitor

LogicMonitor

Overview

What is LogicMonitor?

LogicMonitor provides an agentless SaaS-based monitoring platform. LogicMonitor provides prebuilt integrations and an open API, and is designed to provide monitoring across networks, servers, applications, websites, and containers, including insights and reporting capabilities.

Read more
Recent Reviews

New LM Customer Experience

8 out of 10
June 20, 2023
We use LM in our organization to monitor a global network of 500+ windows and Linux servers. We have a small server team so we need the LM …
Continue reading
Read all reviews

Awards

Products that are considered exceptional by their customers based on a variety of criteria win TrustRadius awards. Learn more about the types of TrustRadius awards to make the best purchase decision. More about TrustRadius Awards

Reviewer Pros & Cons

View all pros & cons
Return to navigation

Pricing

View all pricing

Enterprise

Contact sales team

Cloud

Website Monitoring

Contact sales team

Cloud

Entry-level set up fee?

  • No setup fee
For the latest information on pricing, visithttps://www.logicmonitor.com/pricing

Offerings

  • Free Trial
  • Free/Freemium Version
  • Premium Consulting/Integration Services
Return to navigation

Product Details

What is LogicMonitor?

LM Envision is a SaaS-based unified observability platform that enables digital enterprises to adopt a cloud-ready operating model for meeting key business demands. LM Envision provides clarity across hybrid enterprise IT, brings diverse IT and development teams together to solve complex problems, and enables IT to innovate faster while improving operational efficiency to the critical IT services they deliver.

LM Envision aims to offer an alternative to the tool sprawl that exists in many organizations today. By leveraging a platform that enables collection, analysis, contextualization insights and exploration of observability data across traditional and modern environments, it helps IT teams to remove the blind spots that come from siloed monitoring tools. And it enables IT teams to rally around a platform that offers a “single source of truth” to quickly triage and resolve problems, leverage AIOps to spot performance trends, and shift their time and investment from operation tasks to work that drives innovation for the enterprise.

LogicMonitor Features

  • Supported: Infrastructure Monitoring
  • Supported: Network Monitoring
  • Supported: Cloud Monitoring
  • Supported: Logs
  • Supported: Server Monitoring
  • Supported: Remote Monitoring
  • Supported: AIOps (data forecasting, root cause analysis, dynamic thresholds)
  • Supported: Database Monitoring
  • Supported: Container Monitoring
  • Supported: Synthetic Website Monitoring
  • Supported: APM
  • Supported: Storage Monitoring
  • Supported: Virtual Machine Monitoring
  • Supported: Configuration Monitoring
  • Supported: Topology Mapping
  • Supported: Customizable Dashboards
  • Supported: Alert Escalation Chains
  • Supported: Reporting
  • Supported: Alerting
  • Supported: 24x7 Live Technical Engineer Support

LogicMonitor Screenshots

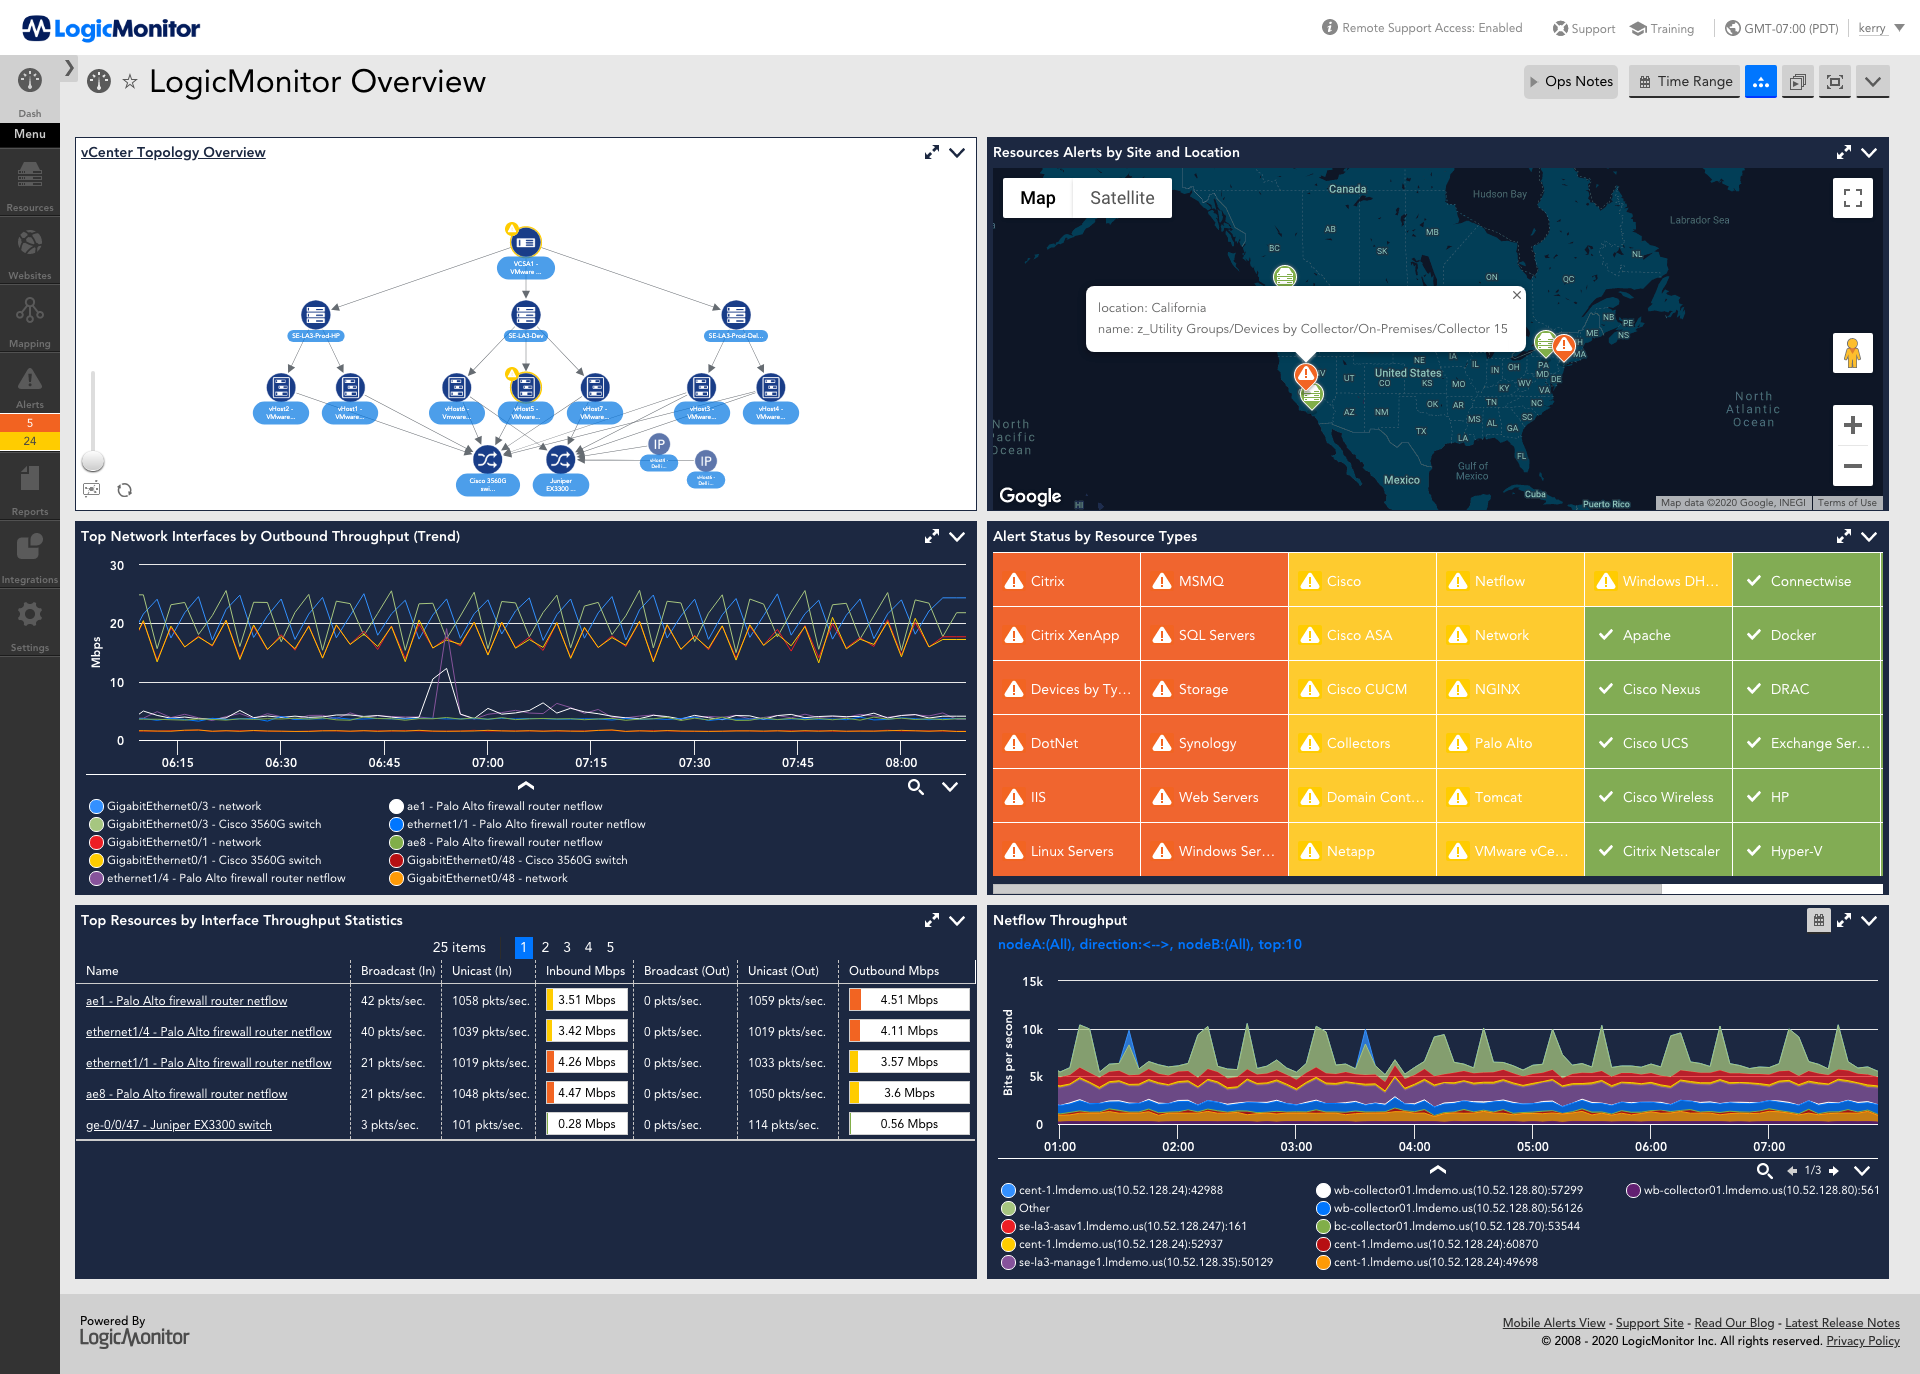
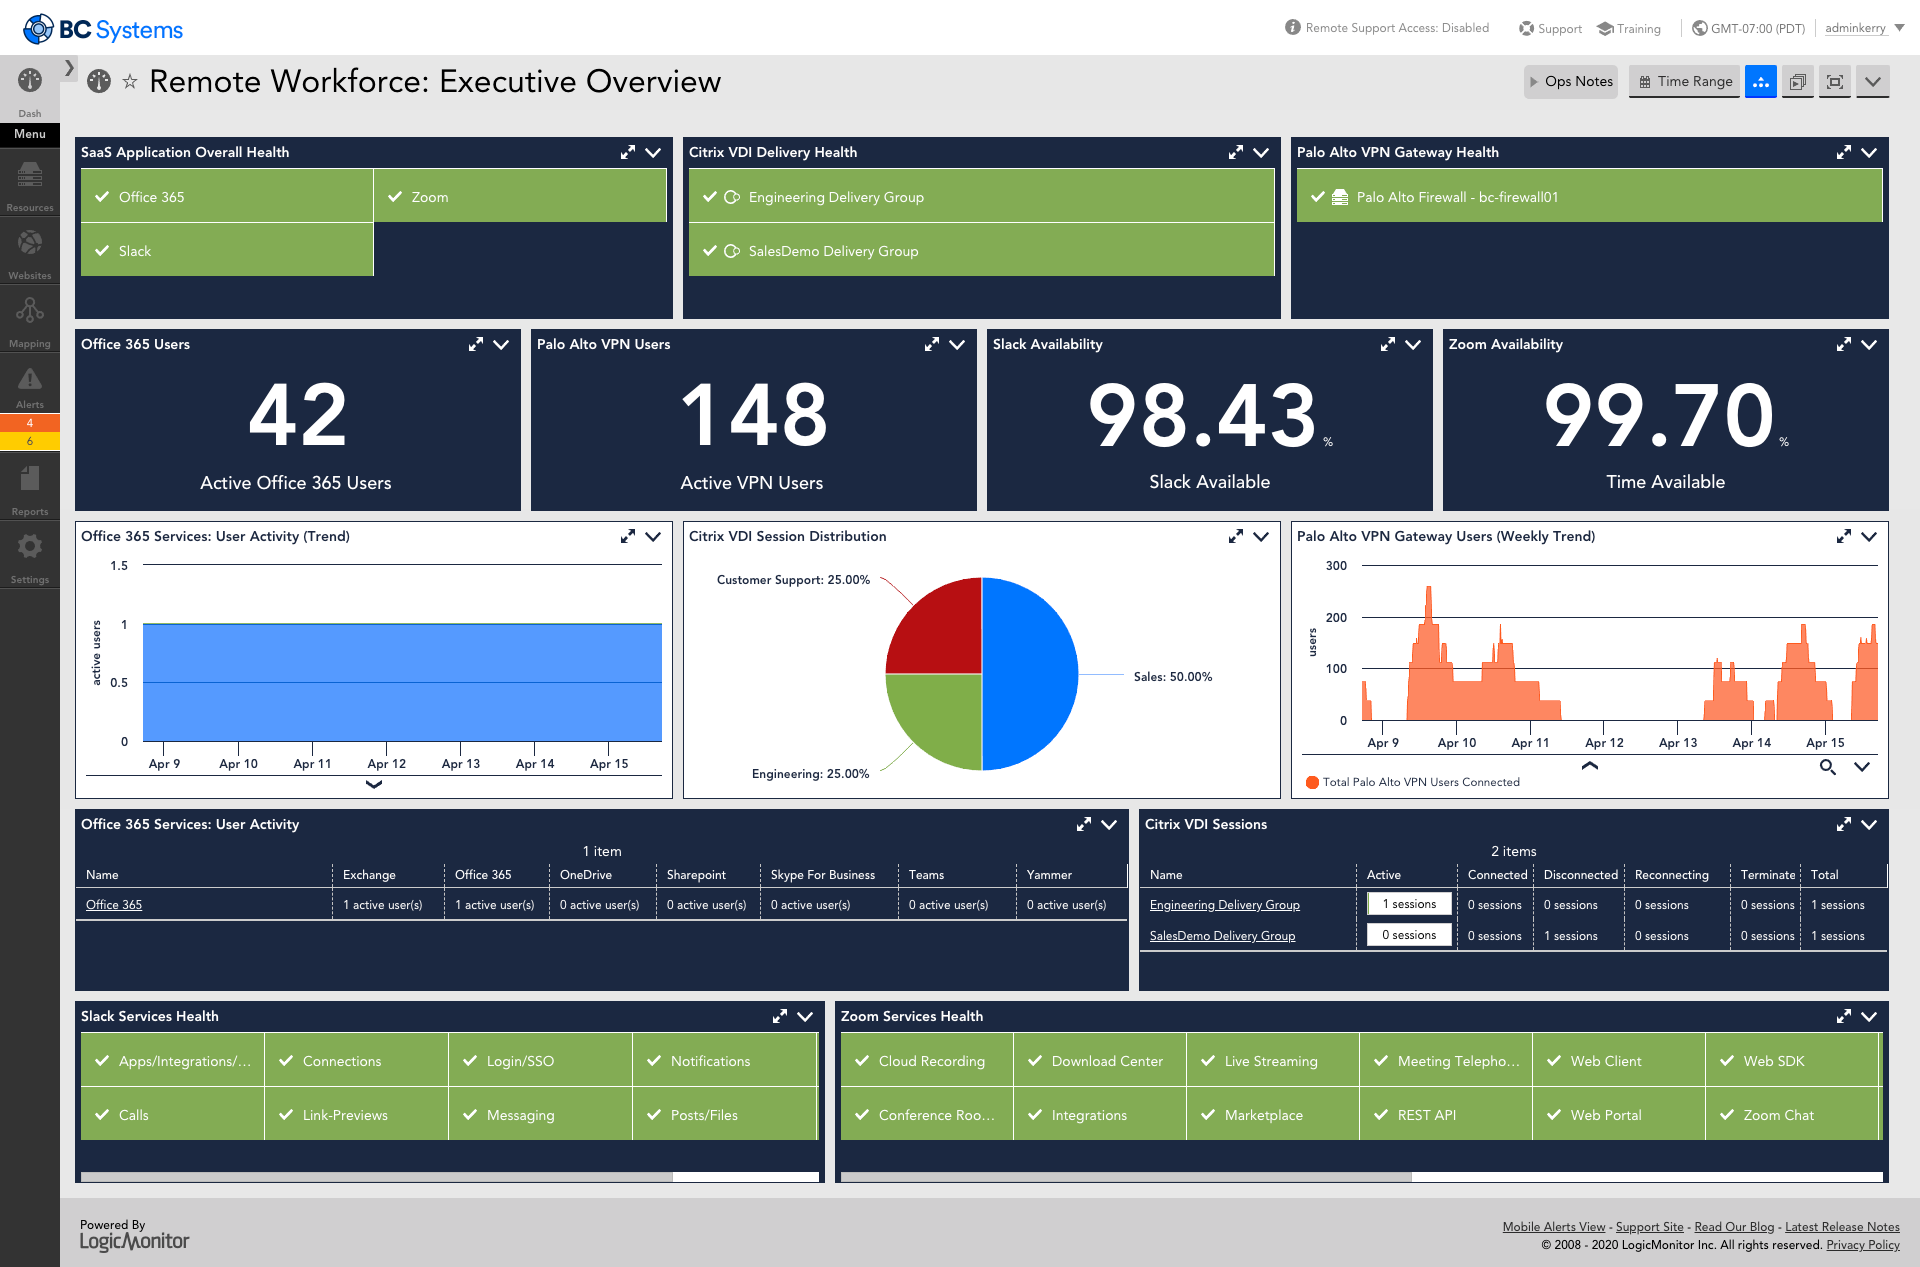
Screenshot of AIOps features for enterprises using technology or hybrid environments with cloud and container resources. LogicMonitor can be used to monitor and improve the performance of complex enterprise networks with dynamic thresholds, topology mapping, anomaly detection, and root cause analysis.Screenshot of LM Envision's comprehensive monitoring and observability capabilities across the IT infrastructure, that help to identify alerts for the most important systems while ensuring the user experience is uninterrupted across the globe.Screenshot of Monitoring that ensures servers and the applications running on top of them are highly available. Helps resolve issues and optimize resource consumption for the server infrastructure.Screenshot of LogicMonitor remote workforce monitoring, which ensures that employees are connected to the systems that keep them productive and provide proactive insight into dispersed systems and third-party outages.Screenshot of Unified cloud monitoring across a hybrid multi-cloud ecosystem.Screenshot of LM Logs delivering log analysis at enterprise scale.

LogicMonitor Videos

LogicMonitor helps Abrigo maintain 99.99% uptime
GCISD accelerates digital transformation with LogicMonitor
who is LogicMonitor?
Carrier partners with LogicMonitor in path to unified observability

LogicMonitor Technical Details

Deployment TypesSoftware as a Service (SaaS), Cloud, or Web-Based
Operating SystemsUnspecified
Mobile ApplicationApple iOS, Android, Windows Phone, Mobile Web

Frequently Asked Questions

LogicMonitor provides an agentless SaaS-based monitoring platform. LogicMonitor provides prebuilt integrations and an open API, and is designed to provide monitoring across networks, servers, applications, websites, and containers, including insights and reporting capabilities.

Datadog, PRTG Network Monitor, and Dynatrace are common alternatives for LogicMonitor.

Reviewers rate Support Rating highest, with a score of 9.

The most common users of LogicMonitor are from Mid-sized Companies (51-1,000 employees).

LogicMonitor Customer Size Distribution

Consumers0%
Small Businesses (1-50 employees)29%
Mid-Size Companies (51-500 employees)41%
Enterprises (more than 500 employees)30%
Return to navigation

Comparisons

View all alternatives
Return to navigation

Reviews and Ratings

(311)

Attribute Ratings

Reviews

(76-100 of 162)
Companies can't remove reviews or game the system. Here's why
Score 9 out of 10
Vetted Review
Verified User
Incentivized
We use LogicMonitor as a monitoring tool to support all our customers environments. We have 130+ customers associated and we are monitoring their environments using LogicMonitor. Mainly for Servers, Databases, Websites and other Application checks. It makes our work a little easier as once we add a device (server) to LogicMonitor, it discovers all its parameters and loads it on the console so that we can pick whatever we need to make monitoring live. Also, we have an option for using custom scripts for any new type of monitor based on customer request. Tuning of alerts and notifications to customers and other support team is very easy, clear with this tool.
  • When we add a device, all of its components/parameters will be discovered automatically and it makes our job easier to pick which parameters that we need to monitor.
  • As it is agentless, with a single collector we can monitor 100+ devices and possibility of customization depending on requirement.
  • Excellent alert tuning and alert routing functionality has been configured.
  • Integration is at its best as we can integrate with third party ticketing tool, mails and we can even send text messages and also voice calls for alerts.
  • It can improve more on collection method time for certain Logic modules and identifying issue using troubleshooter.
  • Need more customization to deploy shell scripts to monitor our Oracle application environments.
  • Always can improve in adding more new type of additional monitoring type to improve of the scope.
With the current monitoring tool which we have, for every server we need to add multiple monitors which consumes lot of time and the environments where there are multiple devices, apps, switches, databases that needs to be monitored. LogicMonitor comes into the picture and will help to deploy monitoring of different environments within a short amount of time.
Best alert routing and alert tuning tool which we used so far and has helped in identifying a lot of critical issues.
January 12, 2021

LM Review

Manishh Arora | TrustRadius Reviewer
Score 10 out of 10
Vetted Review
Verified User
Incentivized
We use LM for our customers. This gives them a unified view of what's going on.
  • Dashboards.
  • Alert Deliveries.
  • Custom DataSources.
  • Integration with AWS, Google Cloud.
  • Mobile Application.
  • Showing Absolute numbers in the dashboards/graph instead doing average/sum.
Well suited where an organisation wishes to have a unified view of hardware stats and software stats... single monitoring window.

Less appropriate for those who need to know absolute numbers of data coming in instead of getting average of minimum 1 minute in the graph. For example, my application is sending 1 requests/second...Now what LogicMonitor does is, it doesn't show per second graph...It will wait for 1 minute and average out requests which is a pain. I will never come to know the surge as it averages down the number. And moreover, this is available in all freeware too.
Score 9 out of 10
Vetted Review
Verified User
Incentivized
LogicMonitor is used by our company to monitor our infrastructure.
It is used only by the monitoring team who are responsible for installing LogicMonitor on production servers and has limited access to other members of the organization.
It addresses the problem of being a single point of tool for monitoring the entire servers on our infrastructure instead of relying on individual tools for different purpose.
  • It is agentless monitoring tool which means from single server we can monitor almost 300 + servers.
  • Installation and setup of LogicMonitor is very easy when compared to other tools available in the market.
  • The report feature of LogicMonitor is too flexible to generate report of custom requirement.
  • It is web based URL access which again saves infrastructure cost.
  • The installation option given in initial stage of adding a server is bit confusing. Would be helpful if suggestion can be provided by LM for which can be chosen for which configuration depending upon number of servers.
  • Devices section is too generalized for categorization and viewing. It would be helpful if it split into two or three more depending upon origin of device like cloud or inhouse data center.
  • There should be a single point of interface where we can see how many devices can still be added to a collector which gives an idea of room of how many servers can still be added.
Well suited:
  • For report generation which will be helpful for interaction between clients and CSM.
  • As a single point of contact for monitoring an entire network infrastructure.
  • For enterprise that needs bulk of its servers to be monitored.
Score 10 out of 10
Vetted Review
Verified User
Incentivized
-Set scans of specific networks to make sure no devices are missed in monitoring
-Lots of granularity when creating new roles for users
-The best support, 24x7 chat support always available
-Able to integrate into our ServiceNow and create / update tickets via API.
-Meraki cloud monitoring (all automated and comes out of the box)
-Calling and texting based on our alert rules (no extra charges, even for int. numbers)
-Dashboard creation
-SNMP monitoring of critical devices (built in downloadable event and datasource from LM repo, you'll find special monitoring for many types of devices)
  • Support
  • Alerting for host downs / critical issues
  • Calling / texting per chain set
  • Flexibility on when hosts goes into overage
  • No phone support, unless gone through chat and scheduled
  • Newer Meraki monitoring eats up too many license
[LogicMonitor] is not a SIEM tool or log aggregator per say, although it can act like it in some ways, more of a very advanced monitoring tool with lots of extra features you don't usually see.

It works great for what its meant to do, and also provides a good amount of extra features (dashboards, regex log matching, log file alerting, anomaly detention and future predicting) that make the product worth it. I love that they are always working to improve it and keep their customers happy.
Score 10 out of 10
Vetted Review
Verified User
Incentivized
In my organization, we primarily use LogicMonitor within the IT department only, but to monitor organization-critical equipment. We are doing active monitoring on all network and server equipment across all of our business locations and datacenters. LogicMonitor's alerting allows us to respond proactively to issues in our environment to help minimize the business impact of them.
  • Autodiscovery/Autoproperties in LogicMonitor makes adding devices easy.
  • Collector or 'probe' failover is very easy to configure, leading to solid redundancy.
  • The tool allows for easy to build dashboards for effective one stop monitoring.
  • Reporting on historical data is useful for identifying performance trends or issues.
  • Dependencies. I do not like having to use the Mapping feature to get this functionality.
  • Modifying and updating data sources is somewhat cumbersome and could be a bit streamlined.
LogicMonitor in my opinion is the top cloud-hosted monitoring tool. The way the configuration is stored and how the collectors integrate is very impressive and reliable. Other monitoring systems that started on with only on-prem options and are only recently moving to the cloud have not done as good of a job at this.

That being said, if you have a requirement to keep all data and monitoring infrastructure on-premises, then LogicMonitor is not the tool for you, as I do not believe that is even an option.
December 25, 2020

Logic monitor

Mark Pote | TrustRadius Reviewer
Score 8 out of 10
Vetted Review
Verified User
Incentivized
We required a product to help us monitor our customers Azure environment. The in built Azure reporting was not up to the full requirement of what we needed.
  • The Dashboards are a very useful feature for wall boards in the office
  • Email notifications to warn of targets being hit
  • Large variety of alerting options
  • Can seem very complex to begin with due to the amount of configuration options
LogicMonitor has managed to inform us of issues with customers sites before the customer was aware of the issue themselves.
Score 9 out of 10
Vetted Review
Verified User
Incentivized
We currently use logic monitor for internal systems and on external client systems. We are also in the pre-planning stages of rolling this out across new clients as an advanced monitoring package.
  • Azure monitoring
  • Onsite monitoring
  • SQL Database monitoring
  • Steep learning curve.
  • Aggressive out of the box monitoring.
LogicMonitor is well suited to any environment that requires advanced monitoring. The only thing that may not suited is the budget.
Score 9 out of 10
Vetted Review
Verified User
Incentivized
LogicMonitor is one of the well-organised tool in the market and very easy to adapt to any industry. It has everything that you need for your company. We have been looking for more than 2 years [for a] tool like LM. This is the latest cloud-based monitoring tool that can monitor the cloud apps.
  • Easy to access.
  • Cloud monitoring.
  • Agent-less monitoring tool.
  • You need to learn the Groovy script.
  • WMI Troubleshooting.
  • SN integration.
Score 9 out of 10
Vetted Review
Verified User
Incentivized
Our IT department uses LogicMonitor to monitor all our infrastructure across the whole organization.
  • Automation
  • Documentation
  • Alert escalation
  • Build a community around the product that creates scripts
I think LogicMonitor is recommended for companies of any size. It is a scalable monitoring solution.
Score 9 out of 10
Vetted Review
Verified User
Incentivized
We use LogicMonitor here in IT at my company to manage our servers, as well as our underlying infrastructure. In addition to it providing a baseline level of monitoring, we also use it as our configuration backup for our networking gear. We like it primarily due to ease of use, and ease of ability to access current and historical information. It also seems like it would be a great tool to monitor for proactive remediation of some issues, but we haven't really had the staff-time to get it set up how we'd like for that.
  • Ease of configuration.
  • Ease of viewing the data.
  • Robustness of data collected.
  • Alerts page filtering is confusing.
  • Took a bit to get Windows Server service monitoring set up.
  • Haven't found a good way to have LM itself handle proactive remediations without doing something hack-y on escalation chains.
I think LM is great if you're looking for a good, easy to use monitoring tool that is highly extensible. You can find modules for almost anything (I've even heard of it being used to monitor beer keg status at their own office!). It's great for getting a ton of visibility into your environment while also minimizing setup time.

It does lack in the automated proactive remediation department; I haven't found a way to do that easily yet. And while its tuning is very good out of the box, I have yet to find a monitoring tool in general that doesn't require any tuning, and LM is no different here. And while you can send Netflow data to it, it seems like it's no replacement for a full-on NMS, though it can work very well in conjunction with one.
Score 8 out of 10
Vetted Review
Verified User
Incentivized
[LogicMonitor is] used across multiple sites. The problems it addresses is monitoring consolidation requirements.
  • Consolidation of monitoring
  • Alert thresholds are easy to adjust
  • Grouping of different sites can be done on the dashboard
  • Exporting of analytics in other formats beside xml
[LogicMonitor is] well suited for Multi-site/company monitoring with alerts going to different site/company technical teams.
December 18, 2020

The Lowdown on LM

Score 10 out of 10
Vetted Review
Verified User
Incentivized
We use [LogicMonitor] to monitor servers (real and virtual) and network devices etc. It makes it simple to have our eyes on everything at once.
  • Tells us if a server is down.
  • Tells us if a network device is down.
  • Tells us if a CPU is near 100% utilization (or any level we define)
  • Tells if disk space is running low.
  • I haven't got any complaints, it's quite robust.
[LogicMonitor is] great for keeping an eye on infrastructure at a small scale (office-wide) or large scale (planet-wide).
Score 7 out of 10
Vetted Review
Verified User
Incentivized
[LogicMonitor] is being used by the IT department to monitor for outages across the companies IT solutions. The software monitors telephone, internet, etc to ensure that all of our business segments are operating properly. This addresses the problem of business outages.
  • Business outage reporting
  • Monitoring IT services
  • Price
  • Lots of emails
LogicMonitor is critical for our retail business to ensure that none of our stores have gone offline and to report any of those outages in a timely manner.
Score 10 out of 10
Vetted Review
Verified User
Incentivized
LogicMonitor usability and user friendly dashboards helps us to tackle almost all monitoring points.

Yes, many teams in my organization use it for the performance management of the application servers.

LogicMonitor alerting of system failure or high usage is very help to prevent major P1 Incidents beforehand and does saving SLA of high availability of the application websites.

In my company LogicMonitor is used for almost all Infra monitoring (servers, switches, routers, site to site vpns). Incident management timelines.

If you are looking for Infrastructure monitoring tools, I would suggest LogicMonitor for it will be the best solution.

  • Every minor to minor data point monitoring make it essential for a EPM product high availability.
  • The cross datacenter spread over different location's network connectivity using site to site VPN monitoring.
  • Incredible on sending quickest alerts via mail, LM Dashboard, Pagerduty (Configured 3rd party paging tool).
  • Graphical representation showing every second monitoring.
  • Very easy on configuring new devices and servers.
  • Easy implementation.
  • Email details should be made more new user friendly.
  • And the logs management is very detailed which we liked but need a lite version too for checking just what happened in a single liner.
  • And there should be options to send email only for particular alerts (I am not sure if it already there, but I didn't find it).
  1. Incident Management: Irrespective of P1 or P2, it will help you out on device monitoring. As soon as any server which was down and got rebooted, it will start monitoring the data from next second.
  2. Easy to configure new devices and all together a new implementation too.
  3. User friendly Alerts dashboard.
  4. Fast in reporting on alerts.
Score 4 out of 10
Vetted Review
Verified User
Incentivized
We used LM across the whole company to monitor everything from devices to apps. This was brought in to replace SolarWinds Orion. At first, there were A LOT of items to look at. We had to turn a lot off due to resource issues with the DC collectors.
  • Nice graphs
  • A lot of data
  • Easy to use
  • Way too much info.
  • Fluff has run rampant.
  • Collectors get overwhelmed easily.
Lots of info, and I mean a lot. Nice graphs, and the collectors get overwhelmed easily due to the fluff, so you will be turning a lot of that off. This tool is built more for servers and really does not address Cisco networking well. And it absolutely sucks at the new ACI environment. This is a huge need for us. I am hoping someone at LM begins development with more in-depth ACI monitoring.
Score 9 out of 10
Vetted Review
Verified User
Incentivized
LogicMonitor was implemented to eventually replace all of the various monitoring platforms and systems our NOC uses to monitor internally and externally for all of our clients. The NOC is moving 2K devices from these systems in to LogicMonitor. The benefits of this includes a single pane of glass to view all devices for our clients, view and analyze trends to become more proactive, share dashboards and reports with our client base. Once the migration is completed, the NOC can reduce our monitoring platforms until everything is all moved in to one place, via LogicMonitor.

LogicMonitor will address issues with faults relating to onboarding, system performance issues, increased statistics and logs to analyze, and graphical gauges/dashboards to see trends. Our client base will have access to reports and dashboards using there own portal to see live reporting of all of there devices at any giving time.
  • Automated onboarding.
  • Excellent support staff.
  • Endless monitoring capabilities and features.
  • Detailed and customized reporting and dashboards.
  • Easy scaling options.
  • User interface.
  • Alerts page.
  • Alert descriptions, definitions, etc.
LogicMonitor is well suited for monitoring hybrid environment including network monitoring, cloud portals, application and site monitoring, on-prem infrastructure monitoring, etc. Setting up onboarding scripts that will define properties, and datasources automatically when new devices are added. LogicMonitor makes fine tuning of resources and alerting thresholds easily following a top down approach. LogicMonitor has a great support staff, lots of documentation and a skills training site to learn and develop. I've yet to run in to a situation where LogicMonitor could not be used to monitor a need that we our one of our clients required.

The one area where LM is not suited is managing patching of network gear or servers. I would recommend a different platform if this is a requirement.
December 14, 2020

LM new implementation

Score 8 out of 10
Vetted Review
Verified User
Incentivized
LM is being used to triage and filter alerts.
It appears to be doing a good job filtering out noise.
LM is being implemented to monitor our estate currently 4000 servers, as this is a new install we are currently filtering out unnecessary noise but LM seems to be doing a good job.
  • Drive space alerts.
  • Services not running.
  • Websites down.
  • Servers not responding.
  • High CPU and memory usage.
  • Still in the learning phase but none at the moment.
LM is good at reporting websites down, drive space alerts, services not running.
High CPU and memory usage and trends.
Score 7 out of 10
Vetted Review
Verified User
Incentivized
We use LogicMonitor to monitor client systems and send alerts for those system to our PSA for remediation as needed. We deploy it also to monitor downtime for sites and to let us know if a system is offline.
  • System monitoring.
  • Offline status alerts.
  • Overall alerts to our PSA.
  • Can be a bit hard to filter out noise.
We are overall happy, but don't use it extensively. We use it to monitor various systems and servers, and to let us know if a site has gone offline. We specifically implemented it recently for letting us know if a site has lost connectivity, or that we lost contact with a firewall.
Joe Jacir | TrustRadius Reviewer
Score 10 out of 10
Vetted Review
Verified User
Incentivized
We are a managed services IT staff and use LogicMonitor to support our clients and our own infrastructure. We sell monitoring as a service and Logic Monitor serves a critical role in that service. It helps us monitor everything from Network infrastructure to Windows/Linux Servers to Cloud Resources like AWS and Azure.
  • Very powerful views for Ops teams that need to find root causes quickly.
  • Customizable alerts thresholds and Escalation Chains that work well.
  • Website Monitoring is very robust.
  • Supports Modern Authentication options.
  • Customizable Customer access for Managed Service Providers.
  • Reporting is somewhat difficult to work with to get what you need.
  • Most scripting options requires learning Groovy (might be a pro for some).
  • Web UI can sometimes require refreshing for changes to show up which can be annoying.
Bulletproof monitoring when implemented properly. Always accurate and timely. Making changes to the out of the box settings is easy enough and can be rolled out how you like in terms of thresholds, alerts, and communications. Very broad native monitoring vendor support. Others can be implements without much fuss. Support is very helpful and prompt.
December 14, 2020

Customizable Monitoring

Score 10 out of 10
Vetted Review
Verified User
Incentivized
LogicMonitor is great at automatically collecting many base metrics for our devices and services (like SQL server). It also allows you to expand the base collections using datasources, including completely customizing it to get data from your own collections. It can be somewhat cumbersome to get started, but their support is helpful.
  • Graphs are very easy to navigate/zoom in/out.
  • Can create custom dashboards.
  • Can pause alerts during maintenance windows.
  • Receive alerts based on predefined thresholds.
  • Mobile version is not great and using the website on phone is nearly impossible.
  • It can be challenging to use the different collectors and JDBC collector has some flaws.
  • The auto-sliding is not working very well.
Ability to use datasources/data collectors to get custom data into LogicMonitor. Creating custom dashboards is also very helpful.
Score 10 out of 10
Vetted Review
Verified User
Incentivized
LogicMonitor is being used by a department, to monitor and provide analysis to companies seeking remote support capabilities. It helps to view and create in-depth analysis of systems and issues arising that cannot be found from bare troubleshooting. Clients require monitoring support and LogicMonitor provides that edge to thoroughly check network, systems services and databases.
  • In-depth database reporting on mount points, luns, etc.
  • Networking reporting. Get alerts on network degrading.
  • Server reporting on server health and status. Uptime.
  • Website links reporting when it is down.
  • Robust app not just for viewing alerts.
  • Additional connectors to work with a wide range of software for automation.
  • More user friendly reporting for end users to understand.
One scenario is monitoring a client network and server infrastructure, LogicMonitor is perfectly suited for this. Also, based on the times we are in, remote monitoring is a must and it allows employees to work from anywhere utilizing cloud based services to view alerts and troubleshoot accordingly. The app also proves a great tool.
Sam Kemp | TrustRadius Reviewer
Score 10 out of 10
Vetted Review
Verified User
Incentivized
LogicMonitor is currently being used across our entire organization. Since we are an MSP this is a critical component to our business. Monitoring and alerting is difficult across any organization let alone multiple ones.
  • Their supported device base is second to none, 9 times out of 10 you probe the device and it knows it.
  • Remote access through the platform is a big one for us as it simplifies access to devices without having to log into VPNs or opening them up to the internet.
  • API integration. This was imperative as we needed to be able to manage and track alerts through our paging and ticket system. Their integrations were easy to set up.
  • I think they could continue to improve the API integration allowing us to attach alerts to a particular customer in our PSA.
This is a product you need to dedicate a lot of time to. Without that you're not going to get huge returns. This product can do so much for so many scenarios but without the time it will go to waste.
Score 9 out of 10
Vetted Review
Verified User
Incentivized
We replaced another infrastructure and network monitoring tool with LogicMonitor. We use it to monitor a network consisting of dozens of PoPs, a mixture of colos and cloud. It is primarily used by our NOC and engineering teams, but it is available broadly across the organization and is used in some custom development and application monitoring as well.
  • Approachability, easy-of-use and flexibility in tuning and organizing.
  • Context-based help, complete online documentation.
  • Out of the box capabilities and community-based contributions to monitoring modules.
  • Very active and helpful support teams.
  • Minimal and lacking SNMP trap support.
  • Windows OS monitoring requires Windows OS collectors.
  • No on-prem option (SaaS only).
LogicMonitor is well suited for network and infrastructure monitoring, and as the product capabilities continues to evolve, it will eventually be very capable for monitoring the full stack. Our footprint and scope are such that we are dependent on multiple/best-of-breed tools for full stack monitoring, but other may not have the ability to pursue such an approach. As we continue to partner with LogicMonitor, we'll continue to evaluate the new capabilities they are adding to see if we should expand our usage. In areas where you may have a lot of legacy SNMP trap based monitoring, you may find as we did that the native capabilities of the product are not sufficient in order to migrate, and that augmenting trap handling (while you work to deprecate as much trap usage as possible) using another product is required. For the long-term though this product is heading in the right direction and we've been very pleased with our experience so far.
December 14, 2020

Great monitoring solution

Score 10 out of 10
Vetted Review
Verified User
Incentivized
We use it to monitor a wide range of systems and applications. We monitor physical, virtual, and cloud machines, running Windows and Linux. We also monitor network equipment, as well as in-house and 3rd party applications. LogicMonitor allows us to get real-time alerts on the things we care about, allowing us to customize our configuration so we don't get overloaded with random events. It's highly customizable to meet our needs.
  • Real-time alerts
  • Great dashboards to visualize data
  • Technical support
  • Network configuration changes
  • Phone support
  • Training curriculum
I like how simple it is to add devices to be monitored. There are built-in templates to detect critical events from your system but it's also customizable to add more (as supported by each particular vendor). Also, the events are customizable too, which is great to turn off unwanted alerts for the things that are not relevant.
December 14, 2020

Ease of use

Score 10 out of 10
Vetted Review
Verified User
Incentivized
[LogicMonitor] is our unified infrastructure monitoring tool, before we had [LogicMonitor] there were multiple monitoring tools sending signals where our SRT folks have to spend some time log in each tool to gather more data, making LM as one unified Infra monitor tool has reduced MTTR, This also reduced our administrative over head as this is a SAAS platform.
  • Infrastructure monitoring out of the box
  • Good integration with ITOM module of ServiceNow
  • Easy Learning curve, and ease of use.
  • Synthetic transaction monitoring
  • Application performance monitoring.
  • Fedramp certification.
[LogicMonitor] is a awesome infrastructure monitoring tool, it support's various tools and technologies out of the box which is a huge plus. Since this is a SAAS platform this has greatly reduced our administrative overhead and helped us concentrate on bringing in various metrics from different devices and applications which is a good thing.
Return to navigation