Catchpoint is an Internet Resilience solution offering services for retailers, Global2000, CDNs, cloud service providers, and xSPs that help increase their resilience by catching any issues in the Intenet Stack before they impact their business.
$10,000
per year
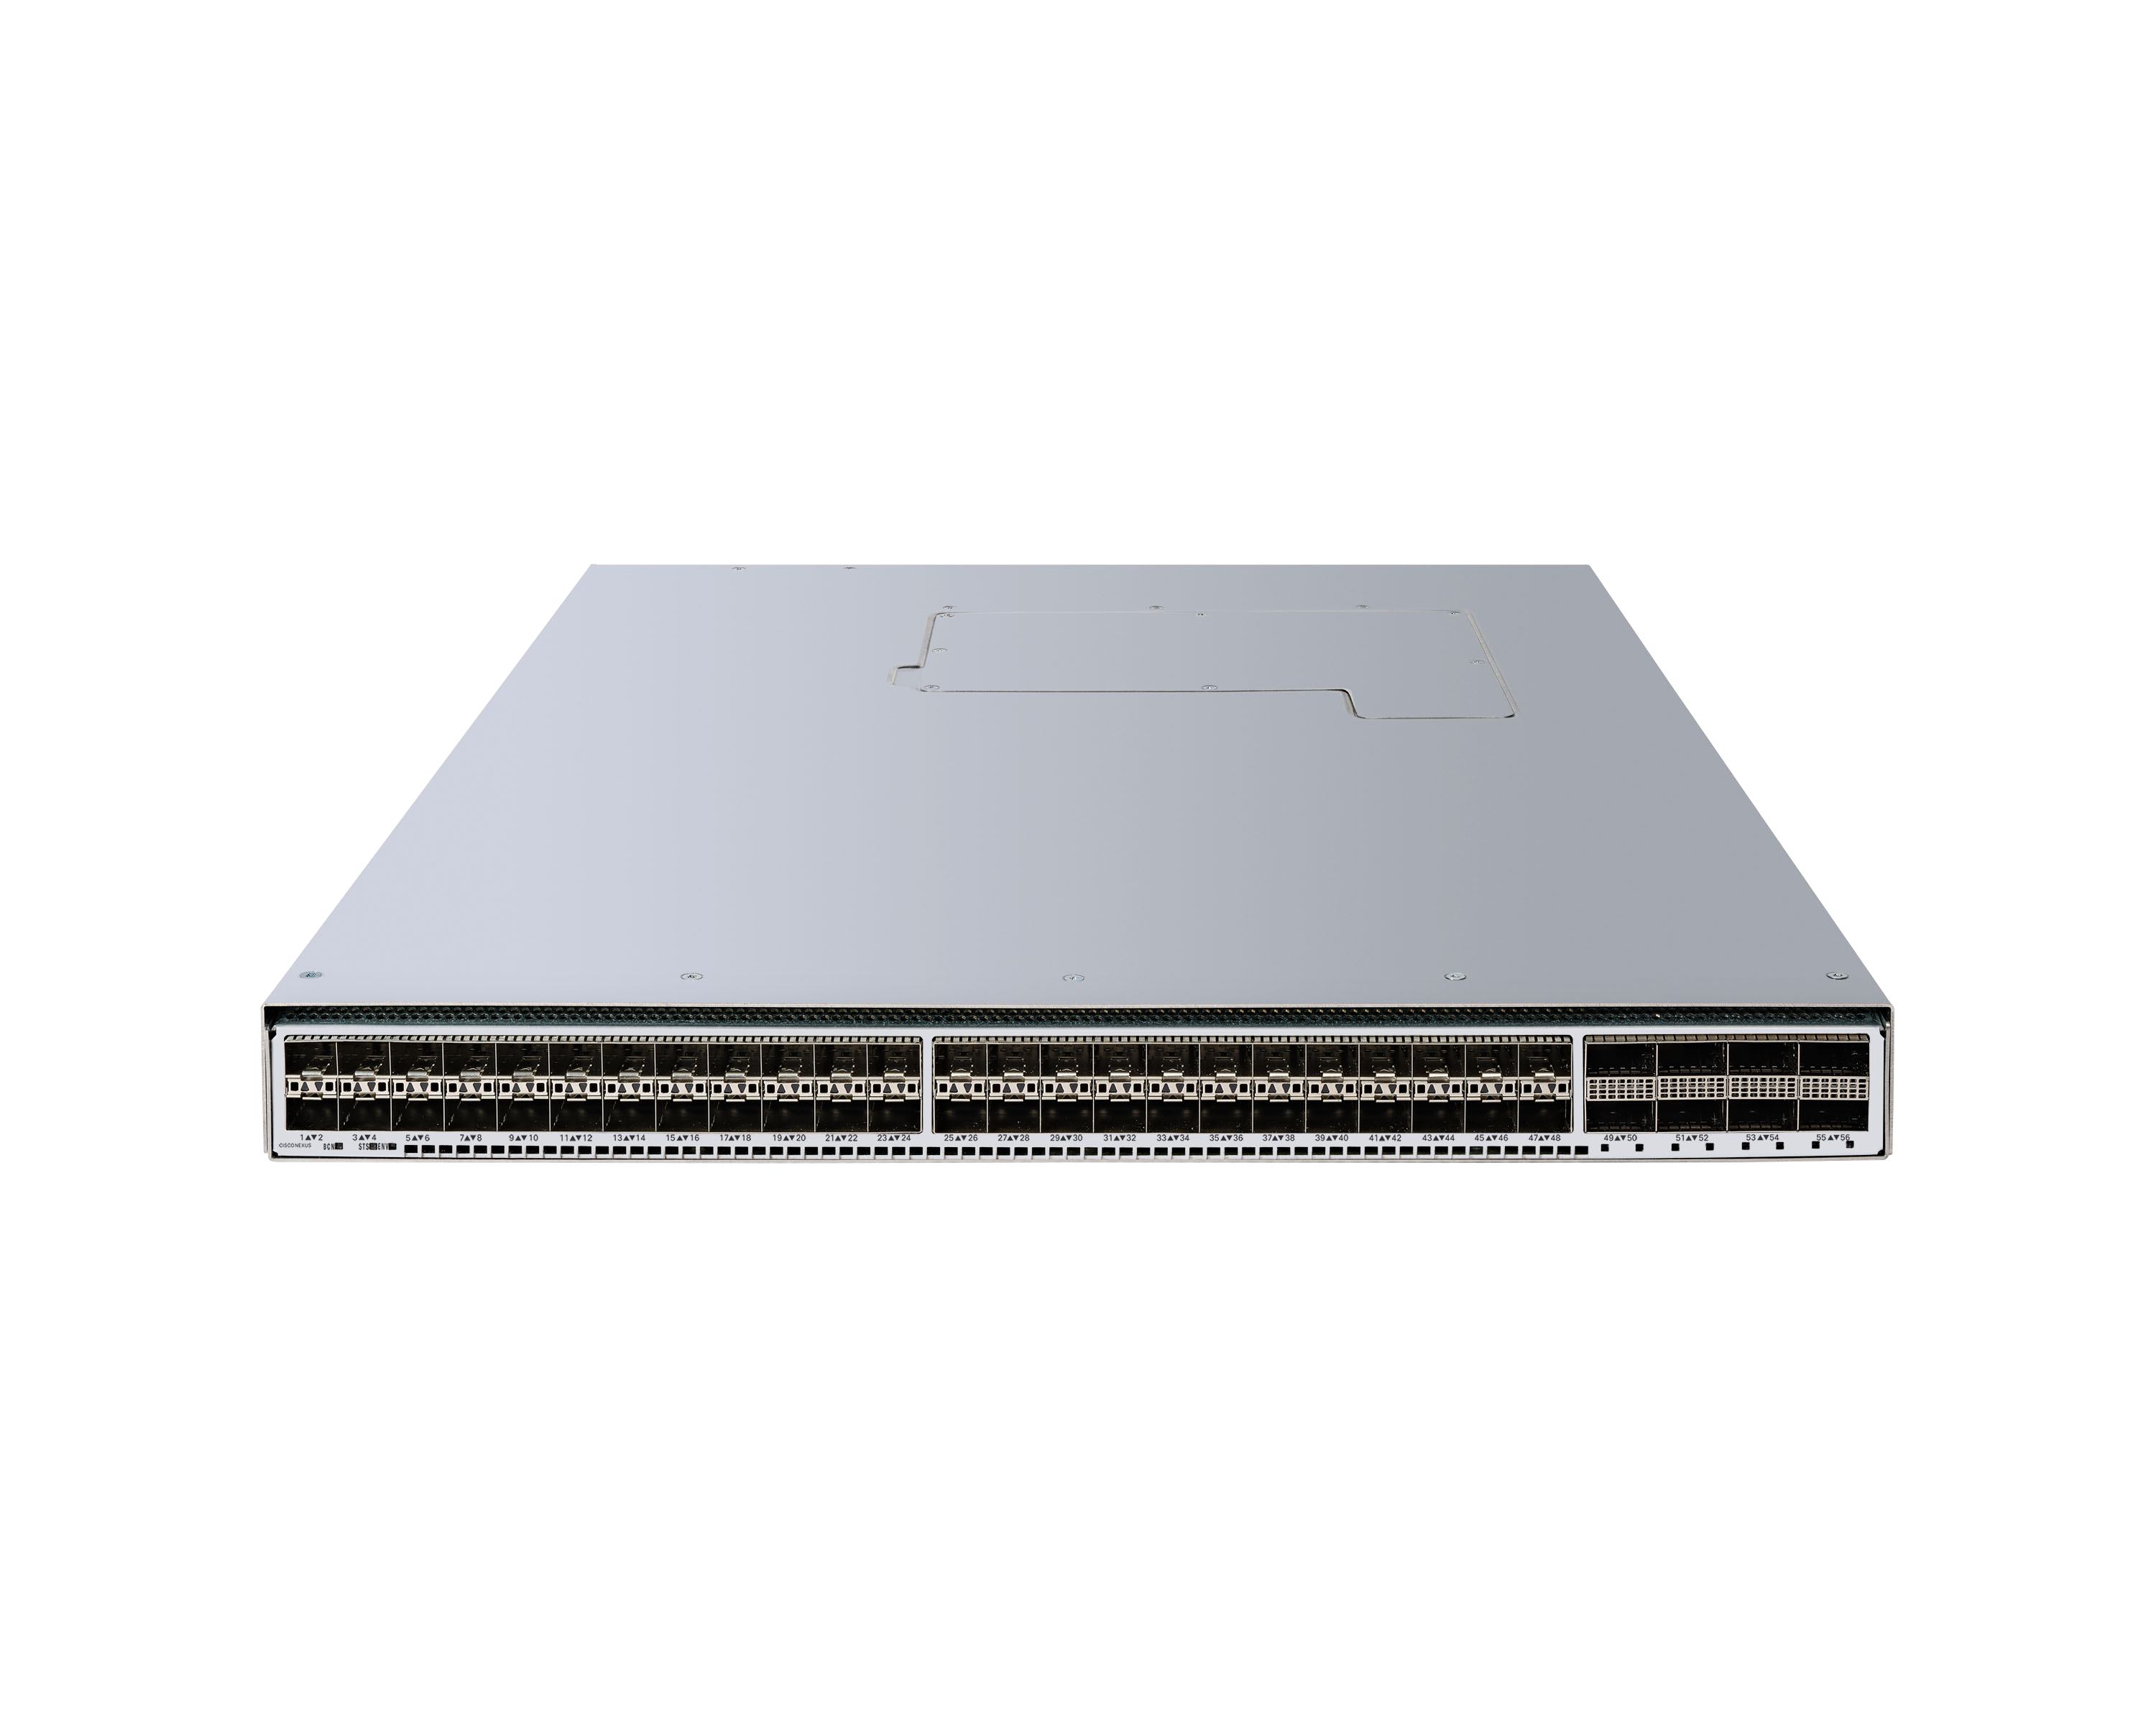
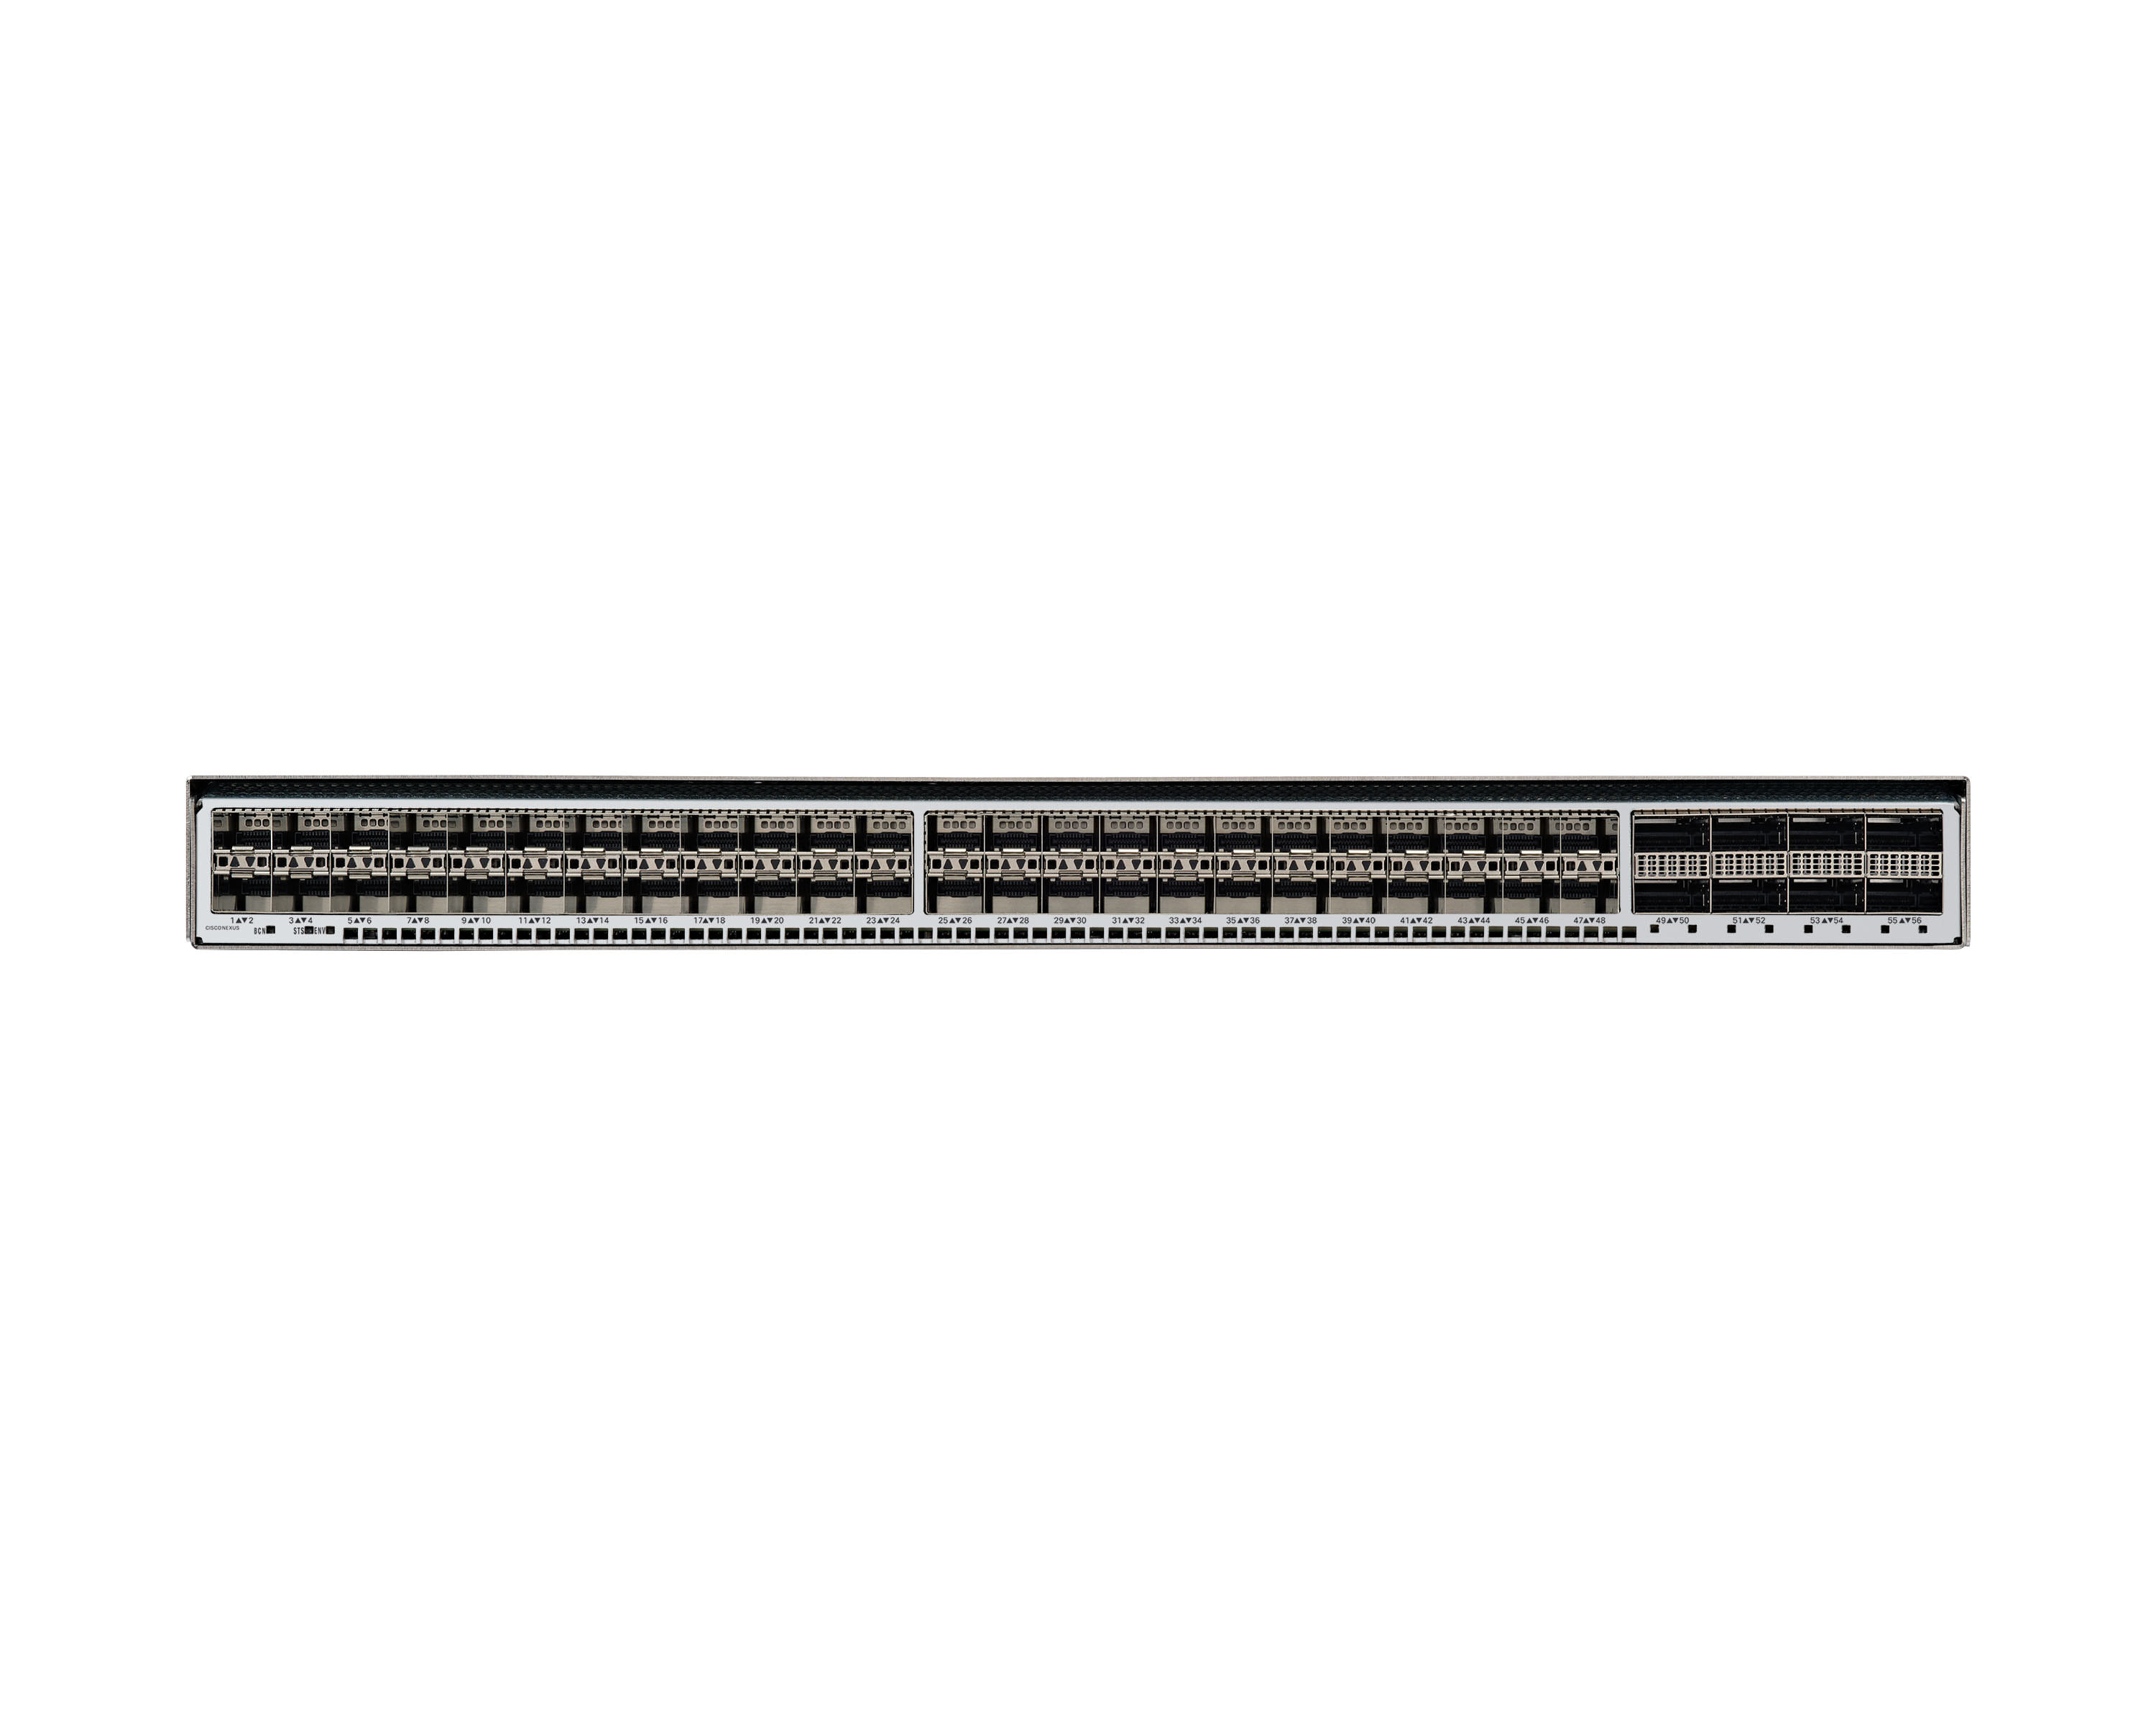
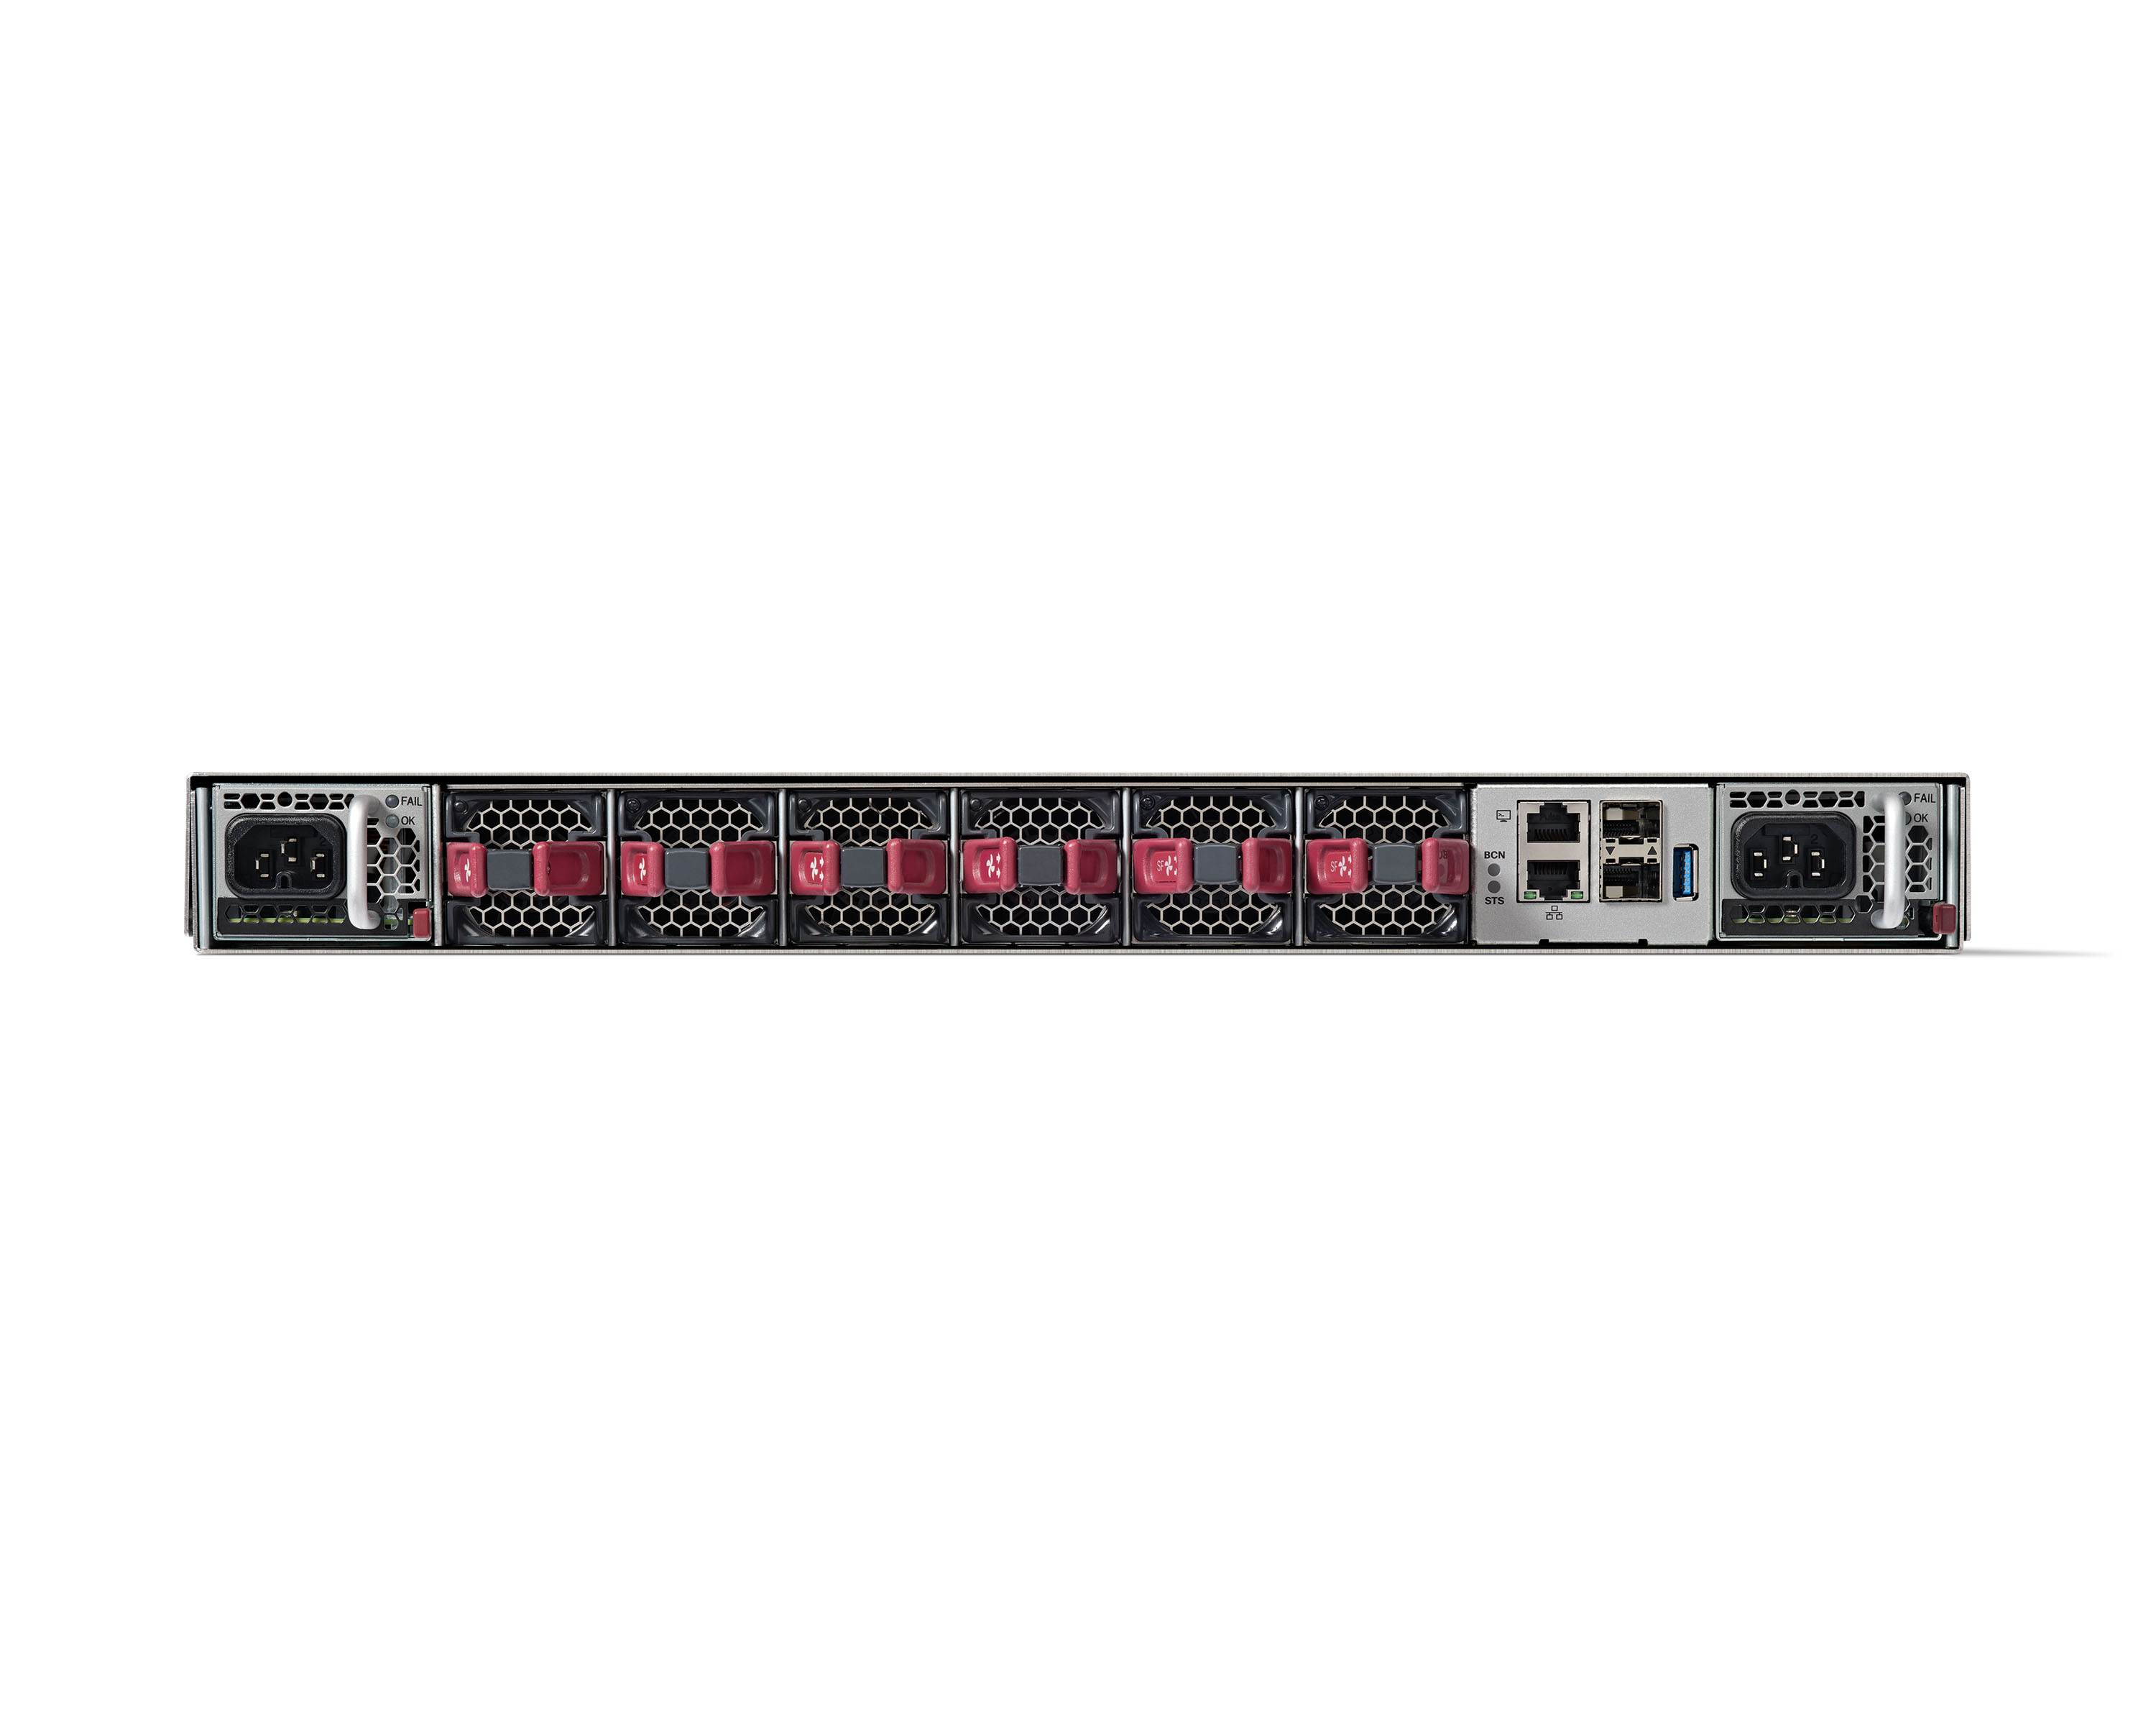
Cisco Nexus Dashboard
Score 8.5 out of 10
N/A
Cisco Nexus Dashboard simplifies data-center networks with automation and analytics. The data-center network helps organizations to meet business demands, and provision reliable data-center networking services as fast as possible, when and where organizations need it. As network infrastructure management is becoming more complex, diverse, and distributed, with multiple configuration points, monitoring tools, and vast amounts of data being generated every second. Cisco Nexus Dashboard is…
N/A
Pricing
Catchpoint
Cisco Nexus Dashboard
Editions & Modules
No answers on this topic
No answers on this topic
Offerings
Pricing Offerings
Catchpoint
Cisco Nexus Dashboard
Free Trial
No
Yes
Free/Freemium Version
No
No
Premium Consulting/Integration Services
No
Yes
Entry-level Setup Fee
No setup fee
Optional
Additional Details
- White glove migration services
- Annual subscription
- Professional Services
- Competitive Benchmarking
I like the synthetic test feature it has from the edge which mimics the real user - that for me is one of the best features. The certificate expiration, the API monitoring, the slowness breakdown to show where the slowdown happens, and more.
We used Cisco Nexus Dashboard specifically for automating the creation of networks in our private cloud environment using a VXLAN EVPN multisite environment. It integrates into Infoblox well. It's also very suited in network troubleshooting for past and present issues. Where I don't see it being used much is in the campus but it's nice to know we have the ability to add catalyst if needed.
Our standard operating material documents Catchpoint’s breadth on HTTP/Browser, API, Streaming, DNS, FTP, TCP, SMTP, Ping, Traceroute, SSH with content validation and custom widgets/dashboards. This gives SREs and L0/L1 a single place to validate both page flows and the underlying network/application protocols.
Product runbooks use Catchpoint to validate critical steps (for ex, login, overview dashboard, unit dashboards) and to detect DNS issues that break those journeys. so we catch experience regressions even when the backend looks healthy.
We’ve standardized Catchpoint alert categories/templates with ITSM so L0 includes the right analysis in handoffs. This tightened “first message, best message” during incidents.
Our operating procedures use Catchpoint for alwayson availability checks with email notifications and multi‑location verification when a site is down. This is useful for unambiguous “is it up/where is it failing” signals.
Missing Functionality: For our organisation, we use multiple observability tools and what we miss in Catchpoint is its ability to display a list of muted monitors in the dashboard. This was a business requirement for our company where the business wanted to know at any given point of time, a list of monitors that were muted during an outage or a scheduled maintenance. This feature was unavailable in Catchpoint, however, we hope to see some enhancements in the future.
With the latest version release of Cisco Nexus Dashboard to version 3.0.1 I can say that most of the features have already improved but one of the wishlists that I want for ND is the possibility of extracting lists of Anomaly.
Include older versions of Firmware in the list of choices when doing the firmware upgrade analysis, currently only the recommended is in the list of choices.
If possible, include all the prechecks in the Firmware pre-upgrade analysis same in the script provided by Cisco.
The Catchpoint tool has now become an integral part of our DevOps toolkit due to its extensive range of capabilities, including application performance monitoring, network health tracking, DNS visibility, and edge performance analysis. Its seamless integration with our existing monitoring infrastructure has significantly enhanced our ability to detect potential issues proactively, analyze root causes in real time, and resolve incidents much faster, ultimately improving overall system reliability and user experience.
We observe significant product development with each release, along with substantial expansion of functionality. The program code has been consolidated into a single image, which simplifies installation and routine system update operations. Additionally, it is possible to install it outside the production network, which further enhances the solution’s availability.Additionally, the new graphical interface is very simplified and user-friendly.
It's hard to find the functionalities that I am looking for in the application. Even if I did something in the past, after a time I have to re-learn again where the functionalities are. This is a powerful tool, but not user-friendly. Texts in the buttons and menus are not always meaningful or easily comprehensible.
For the end user, it is relatively easy to use. However, some training and practice is a must because the NSO is not as straightforward as the traditional router CLI. For the administrator, Cisco Network Service Orchestrator (NSO) is just like another program running on the Linux system--there is no big difference.
Great and effective automation functionalities and the tools on network security management are the best and easy data reports building. Cisco Nexus Dashboard Fabric Controller feature for the network monitoring and easy management of various services and even offers the best analytics and also powerful integration tools for easy data migration.
The customer support is fantastic as they keep you updated and follow up even though we may not even follow up. Make sure they send a communication so that we remain updated. They value engineers who will get on a call with you to understand any requirement we have on any test, and they bring in the best developers on call.
here was never a need to contact support, as the system includes several commands that allow for self-healing. Even if, after the upgrade process, one of the processes was not running, I was able to quickly find the appropriate sequence of commands that definitively resolved the issue. The entire architecture was designed in such a way as to be resilient to the failure of one node in a three-server setup.
Honestly, the product implementation took 1–2 days to comprehensively manage the client’s entire infrastructure. The delivered on-premise solution, provided as physical servers, quickly builds the required environment in which individual data centers are rapidly added. The data collection process takes some time but also depends on the number of devices in the network.
Smart Bear Foglight Dynatrace CEM Catchpoint: I have used many synthetic monitoring products. Honestly, there are no big differences in features among all the products listed above or that I have used before. Probably, price and support might play big roles in selecting the products. I do not know the prices of these products.
The Cisco Nexus Series switches perform admirably in our blended distributed system. We have been dealing with any of these sorts of switches for over 5 years and have been exceptionally happy with their functionality. Several of our other computer networks in our data rooms have proved effective with Cisco equipment. Because of the simplicity of maintenance and the high quality of technical support provided by Cisco representatives, there is a high level of trust in these switches.
The platform is very well done, and to date, I have had no complaints about the implementation of the platform and no security issues or vulnerabilities. Cisco in all its product releases new versions to resolve security issues or bugs that appear on the platform, this is a big plus.
Catchpoint is not the only monitoring tool we use for our web properties. The test alerts raised by Catchpoint serves as a confirmation of possible outages/problems with an application. This has helped to reduce false-positive alerts thus improving the response of the operations team; they don't have spend time chasing ghosts
The unlimited scheduled tests we can run on the enterprise nodes has been a very cost effective solution compared to similar web monitoring tools
The ability to quickly dive into the test result details help to get to the root cause of a test failure quickly