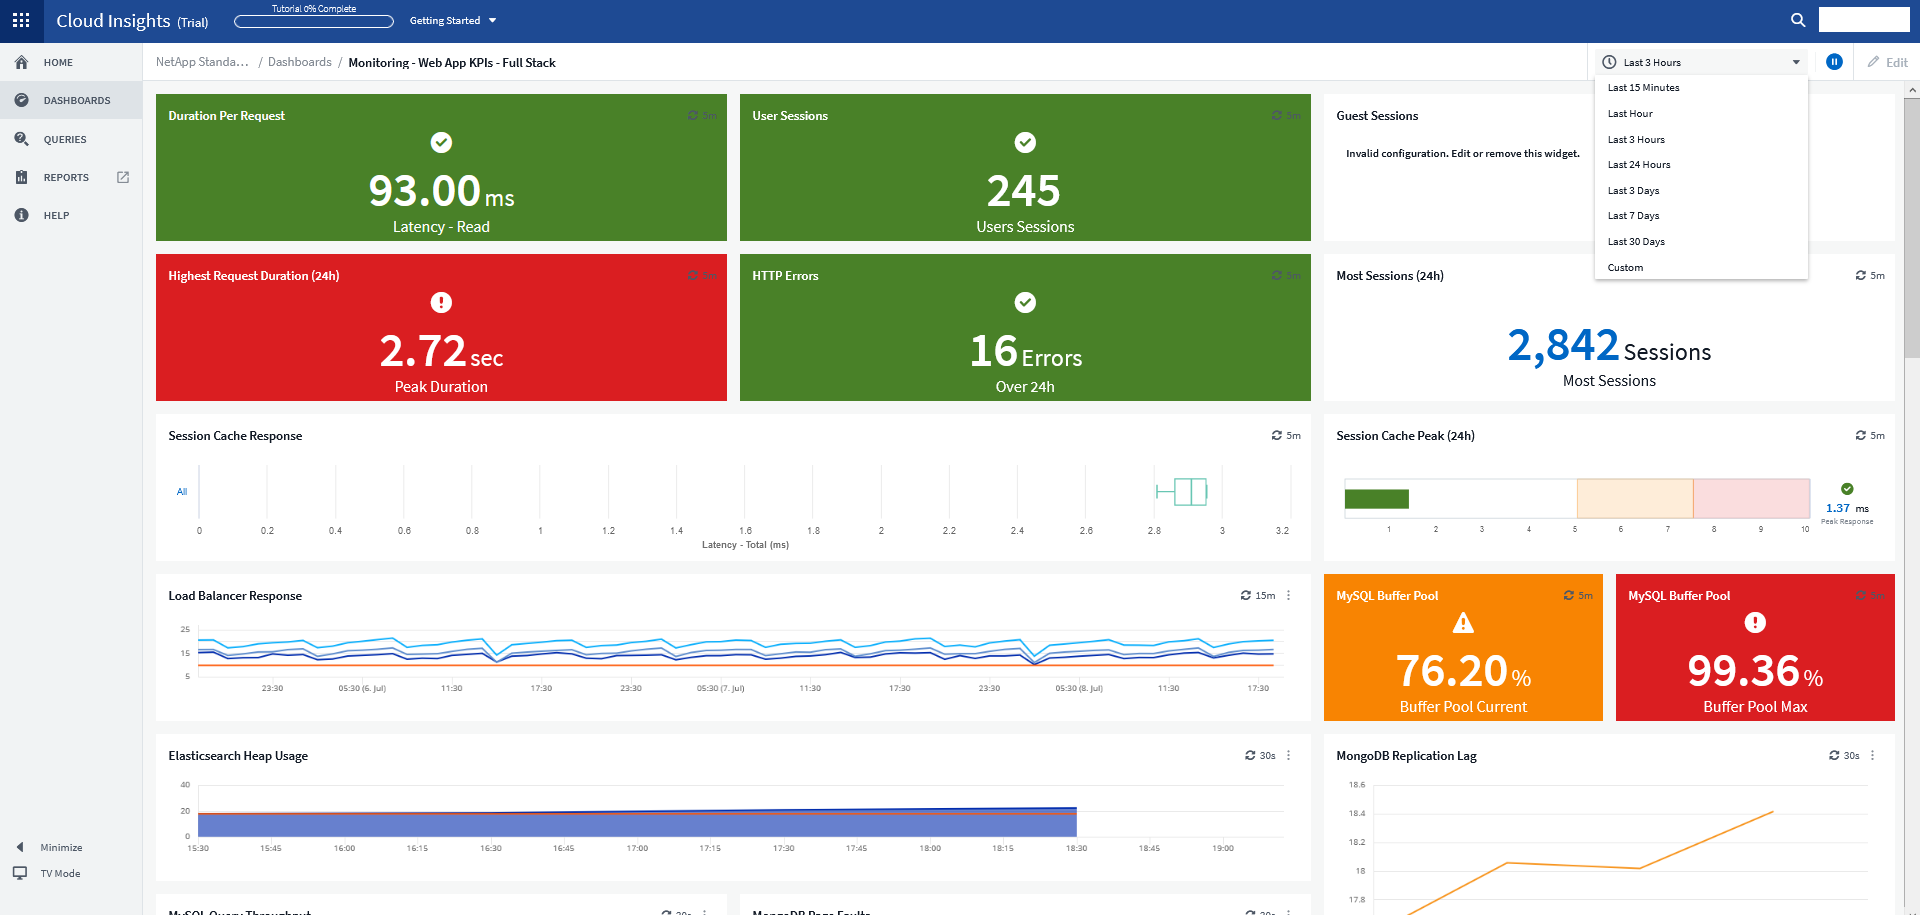
NetApp Cloud Insights is an infrastructure monitoring tool that gives
users visibility into their complete infrastructure. With Cloud Insights, users can monitor, troubleshoot and optimize all resources including
public clouds and private data centers.
N/A
Splunk Infrastructure Monitoring
Score 8.7 out of 10
N/A
SignalFX is Real-Time Cloud Monitoring and Observability for Infrastructure, Microservices and Applications. SignalFX was acquired by Splunk in August 2019. SignalFX Infrastructure Monitoring provides real-time cloud monitoring and observability platform for infrastructure, microservices and DevOps. A new SignalFX product, SignalFx Microservices APM, was released March 2020 to detect issues, provide real-time app troubleshooting, and future-proof expectations.
For example, we had an application slowdown. It looked like the slowdown was storage. However, it was a malformed SQL query that no one realized was pulling data from the storage location that also housed the application. Cloud Insights saved us hours of downtime and frustration. Cloud Insights pinpointed which system was hogging resources. What makes Cloud Insights special is the way it looks at the data collected from the data sources. The insights it provides into the flow of data; sheds new light on how things work in your environment.
Splunk Infrastructure Monitoring is well suited for any complicated environment where you have apps and servers across multiple clouds and platforms and products. If you have a data centre where all your apps and servers are in one single network, you could probably get away with older solutions. But for any modern, complex, hybrid-cloud microservices environment, Splunk Infrastructure Monitoring is a must-have.
SignalFX handles historical metric aggregation exceptionally well, providing a multifaceted approach to event detection based on anomalies.
SignalFX's cost is incredibly flexible with their pricing model of DPM (data-point per minute) vs the traditional "per host" model that most monitoring SaaS use.
SignalFX support is responsive and knowledgeable, very eager to help solve your immediate problems.
SignalFX integrations is vast and constantly growing, making adoption easy even when multiple different open-source technologies are used in your stack.
Good: Stable system with low error rate Easy to use for simple use cases Bad: UI is not very clear for complex usage Mobile view (when logged in from phone) is bad No library for .net
I have been extremely happy with its usability. You can take thins as they are out of the box and it is useful. You can carry it as far as you want to go and every step you take improves your ROI.
I find that learning the interface can take some time. We need a better show-and-tell on how the Teams pages, Dashboard Groups, Dashboards and charts delay. Advance SignalFlow is sometimes hard to build. Some better samples of advanced SignalFlow would be helpful. For example, Splunk SPL has a vast resource of examples.
For a while, we were using Zabbix to monitor our Kubernetes applications and microservices on our infrastructure in more than one public cloud platform. Cloud Insights has much better visualized dashboards. In addition, despite such a large number of quality features, it's still priced competitively.
They’re not for the same purpose but we’re using NewRelic and Honeycomb for monitoring purposes. NewRelic is used for HTTP client monitoring for system related throughput, error, database and external client monitoring. Honeycomb is used to monitor actual HTTP request/response values. Splunk [Infrastructure Monitoring] is used for real-time application related throughout and error monitoring.
Once you install the acquisition unit and start collecting data, you can immediately begin using it. It is very self-explanatory and helpful. I could have used Cloud Insights without working with the NetApp Cloud Insights support team. I am glad I engaged them though. They helped me carry Cloud Insights to a new level and it fast-tracked the process that would have taken me time to complete.
Caused us to get a lot of spam when we redeployed apps and old instances stopped sending metrics. Muting alerts solves this, but people often forget to do it or do it incorrectly.
Helped us find historical info about instances/apps.