Fathom vs. Zoho Analytics
Fathom vs. Zoho Analytics
| Product | Rating | Most Used By | Product Summary | Starting Price |
|---|---|---|---|---|
 Fathom | N/A | Fathom is a management reporting, forecasting and financial analysis tool from the Access Group. It helps users to assess business performance, monitor trends and identify improvement opportunities. Fathom combines business planning with simple three-way cash flow forecasting. | $44 per month | |
 Zoho Analytics | Small Businesses (1-50 employees) | Zoho Analytics (formerly Zoho Reports) is a self-service BI and analytics platform that allows users to analyze their business data and create reports and dashboards. It is designed to help users create and share reports quickly, without IT assistance. | $50 per month |
| Fathom | Zoho Analytics | |||||||||||||||
|---|---|---|---|---|---|---|---|---|---|---|---|---|---|---|---|---|
| Editions & Modules |
|
| ||||||||||||||
| Offerings |
| |||||||||||||||
| Entry-level Setup Fee | No setup fee | No setup fee | ||||||||||||||
| Additional Details | — | There is a 20% discount for all plans if subscribed yearly. Customers can buy add-on rows and users, in addition to the plans listed above. | ||||||||||||||
| More Pricing Information | ||||||||||||||||
| Fathom | Zoho Analytics | |
|---|---|---|
| Top Pros |
| |
| Top Cons | No answers on this topic |
|
| Fathom | Zoho Analytics | ||||||||||||||||||
|---|---|---|---|---|---|---|---|---|---|---|---|---|---|---|---|---|---|---|---|
| Budgeting, Planning, and Forecasting |
| ||||||||||||||||||
| Analytics and Reporting |
| ||||||||||||||||||
| Budgeting Tools |
| ||||||||||||||||||
| BI Standard Reporting |
| ||||||||||||||||||
| Ad-hoc Reporting |
| ||||||||||||||||||
| Report Output and Scheduling |
| ||||||||||||||||||
| Data Discovery and Visualization |
| ||||||||||||||||||
| Access Control and Security |
| ||||||||||||||||||
| Mobile Capabilities |
| ||||||||||||||||||
| Application Program Interfaces (APIs) / Embedding |
|
| Fathom | Zoho Analytics | |
|---|---|---|
| Small Businesses |  MIP Fund Accounting Score 8.7 out of 10 |  BrightGauge Score 8.9 out of 10 |
| Medium-sized Companies |  Centage Score 9.6 out of 10 |  Reveal Score 9.9 out of 10 |
| Enterprises |  Oracle Fusion Cloud ERP Score 8.1 out of 10 |  Jaspersoft Community Edition Score 9.7 out of 10 |
| All Alternatives | View all alternatives | View all alternatives |
| Fathom | Zoho Analytics | |
|---|---|---|
| Likelihood to Recommend | 9.0 (3 ratings) | 8.4 (115 ratings) |
| Likelihood to Renew | - (0 ratings) | 8.8 (7 ratings) |
| Usability | 10.0 (1 ratings) | 8.3 (59 ratings) |
| Availability | - (0 ratings) | 9.1 (1 ratings) |
| Performance | - (0 ratings) | 9.1 (1 ratings) |
| Support Rating | 10.0 (1 ratings) | 7.6 (17 ratings) |
| Implementation Rating | - (0 ratings) | 9.0 (2 ratings) |
| Product Scalability | - (0 ratings) | 8.4 (47 ratings) |
| Fathom | Zoho Analytics | |
|---|---|---|
| Likelihood to Recommend | The Access Group
 Leila Blauner Founder |  Zoho
|
| Pros | The Access Group
| Zoho
 Abhideep Jain Manager Consultant - Business Development |
| Cons | The Access Group
| Zoho
|
| Likelihood to Renew | The Access Group No answers on this topic | Zoho
|
| Usability | The Access Group
| Zoho
 Dr. ROOPESH RAO Head Industry Institute Initiatives/Training and Placement Officer |
| Reliability and Availability | The Access Group No answers on this topic | Zoho
 Michael Weisel Chief Technology Officer |
| Performance | The Access Group No answers on this topic | Zoho
Michael Weisel Chief Technology Officer |
| Support Rating | The Access Group
| Zoho
|
| Implementation Rating | The Access Group No answers on this topic | Zoho
 Rafael Grandizoli Gerente de Operações |
| Alternatives Considered | The Access Group
Leila Blauner Founder | Zoho
 Gerardo Varillas Product Manager |
| Scalability | The Access Group No answers on this topic | Zoho
 Andrés Barrios Rubio Investigador Asociado |
| Return on Investment | The Access Group
| Zoho
 Lonela Marinela Senior Product UX/UI Designer-Developer |
| ScreenShots | Zoho Analytics Screenshots 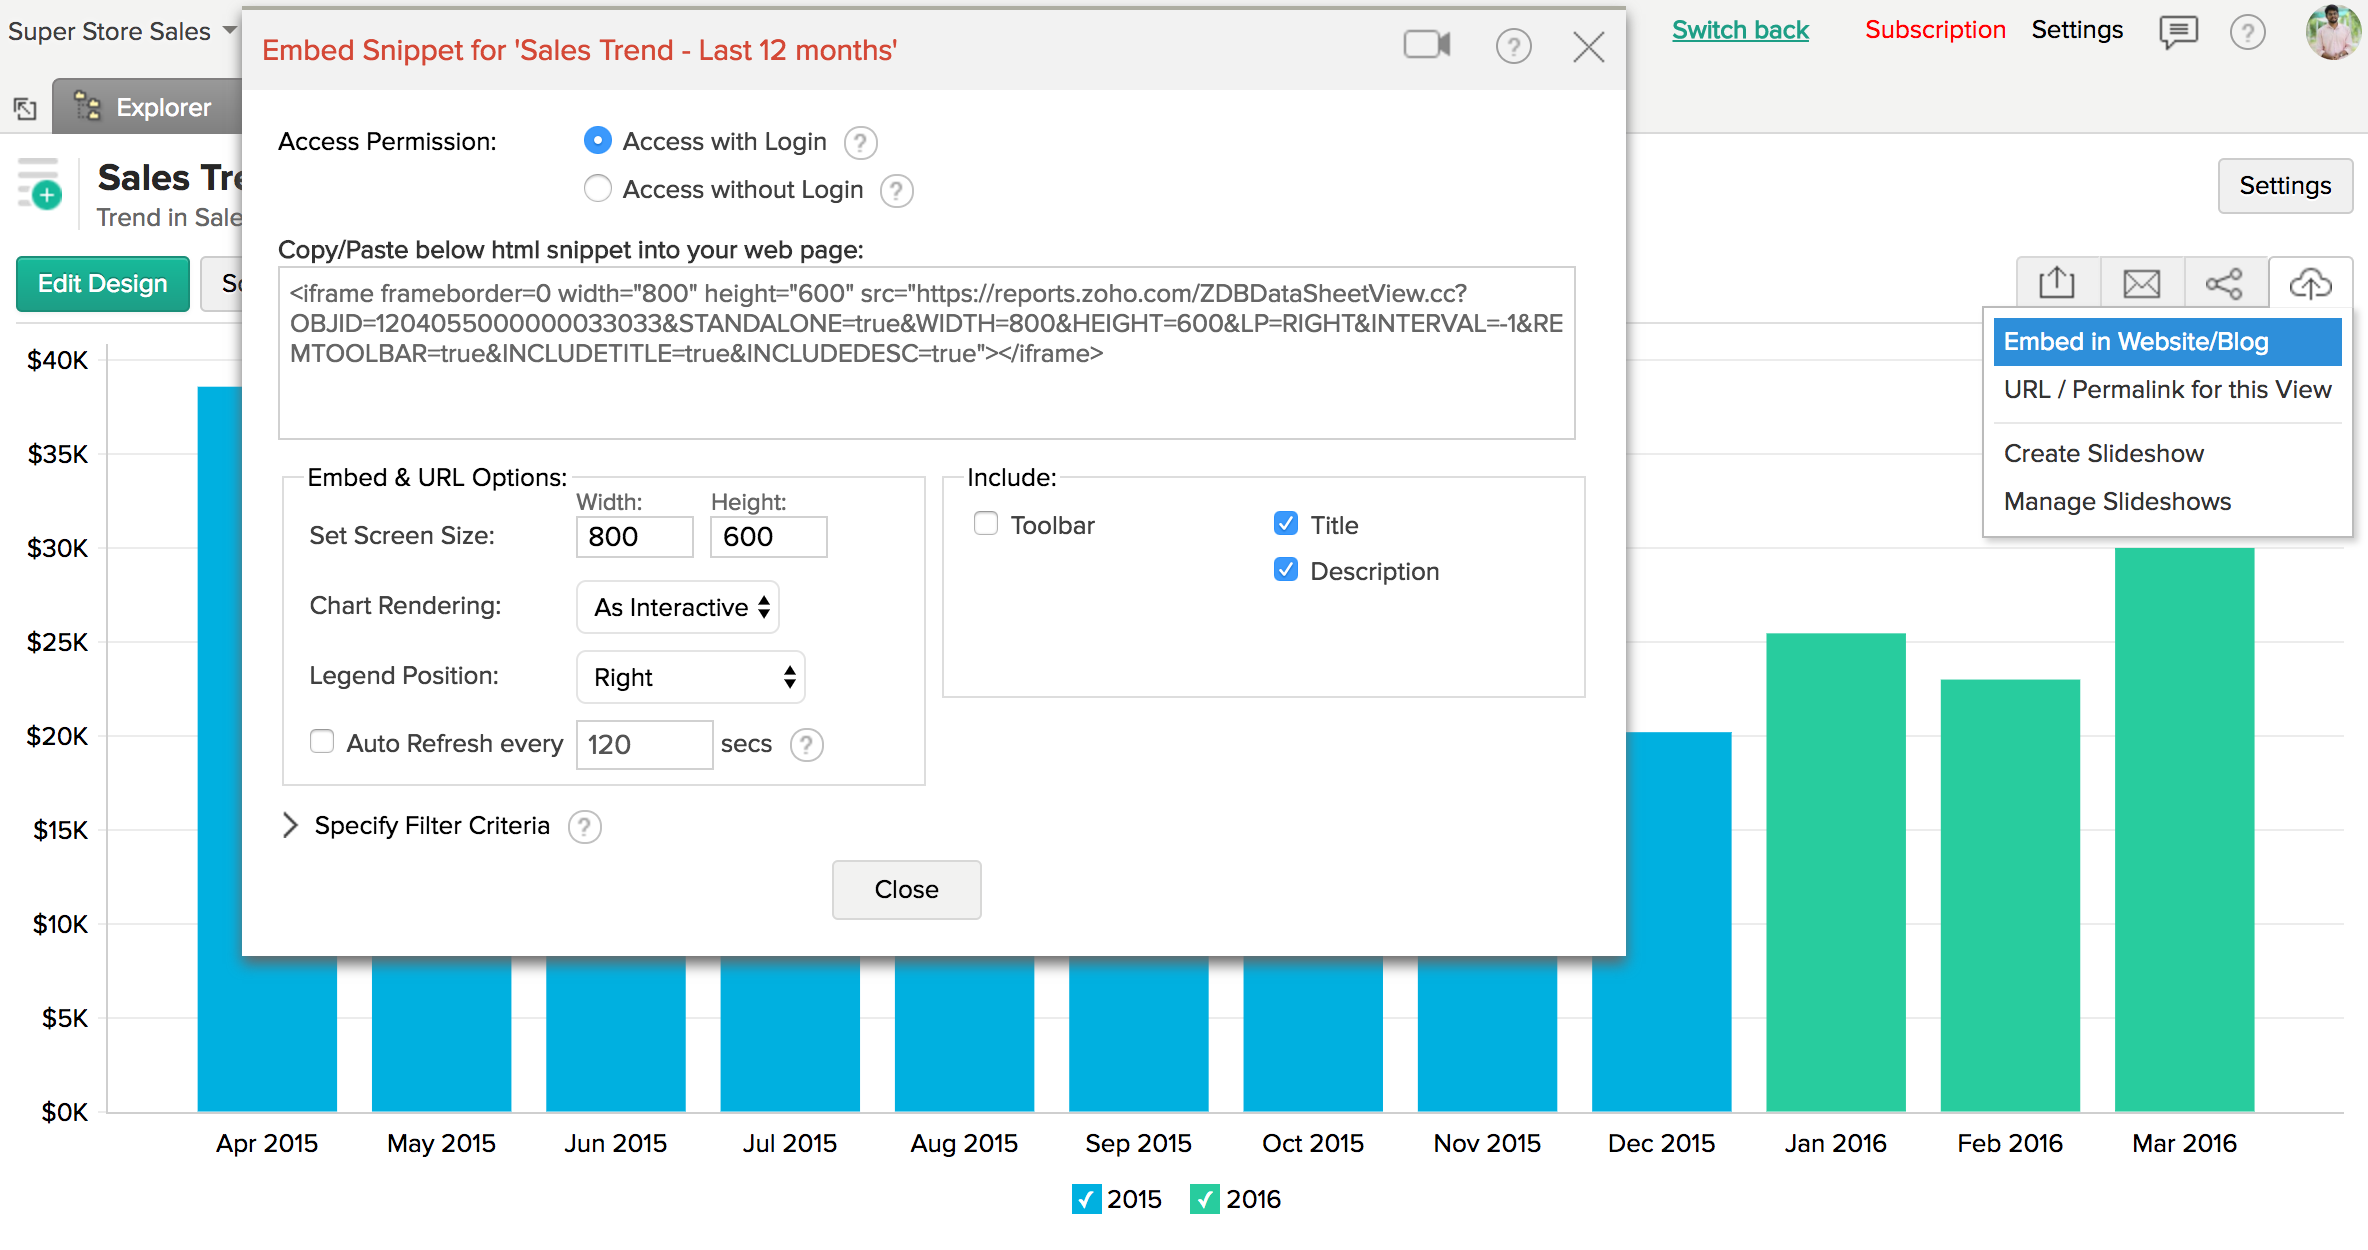 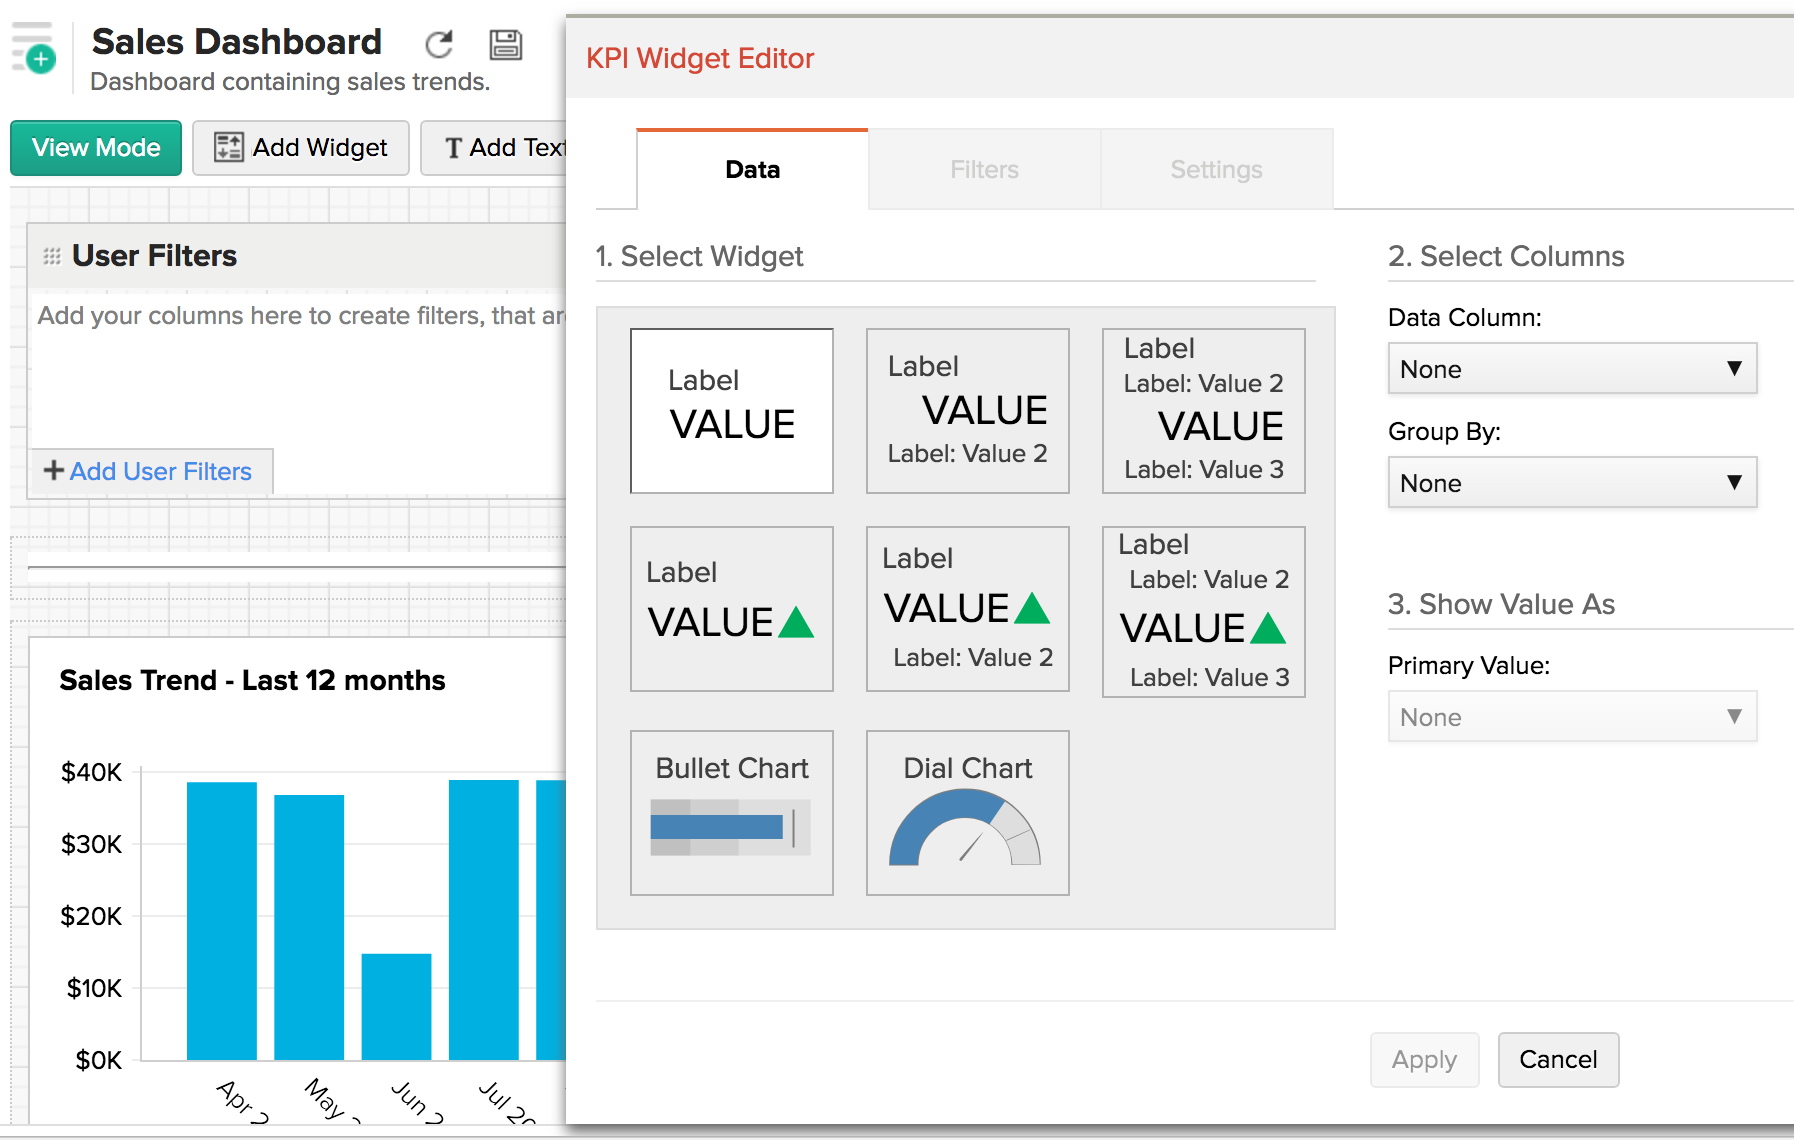   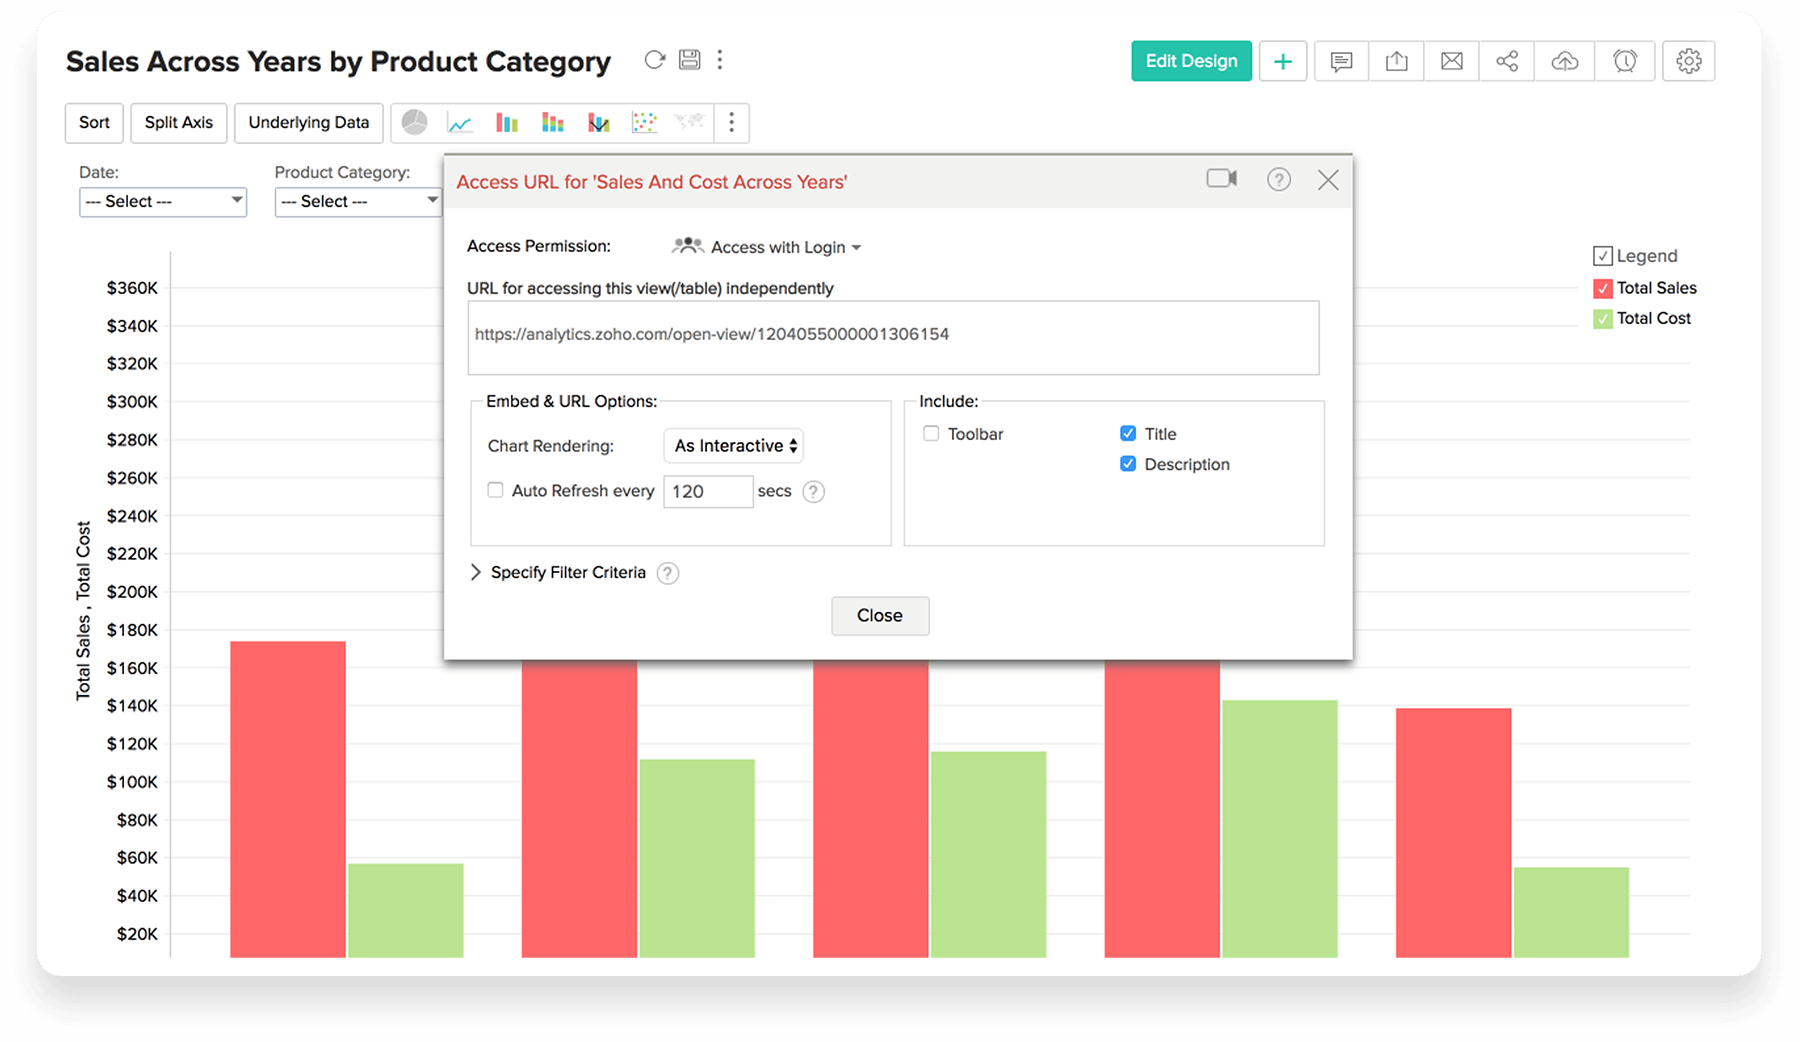 |
