Amazon TensorFlow enables developers to quickly and easily get started with deep learning in the cloud.
N/A
Qlik Cloud Analytics (Qlik Sense)
Score 8.3 out of 10
N/A
Qlik Sense® is a self-service BI platform for data discovery and visualization. It supports a full range of analytics use cases—data governance, pixel-perfect reporting, and collaboration. Its Associative Engine indexes and connects relationships between data points for creating actionable insights.
Microsoft Azure is better than Amazon Tensor Flow because it provides easier and pre-built capabilities such as Anomaly Detection, Recommendation, and Ranking.
AWS is better than IBM Watson ML Studio because it has direct and prebuilt clustering capabilities
The main difference between Qlik and power bi is related to the integration of the tool into the Microsoft world, which can be useful for big companies already equipped with several ms systems. On the other hands, Qlik is simpler, more straightforward and easier to use with a …
Qlik Sense cost of licensing is cheaper compared with other tools which always gives an upper edge in analytics industry with good functionality. More enhanced level of security with better user community group available to discuss about new updates. Understanding of Qlik Sense …
We use Microsoft Power BI too as a BI tool, in my point of view, Qlik Sense's ETL is much better than PowerBi. In another side, PowerBI learning curve is small than Qlik Sense, especially the PowerBI Desktop.
Kibana is data visualization tool in Elastic Stack to visualize and analyze Real Time Logs Capture. It captures Live Streaming data and helps to detect any anomalies, error and bugs, monitoring aspects of any service/ IOT Device.
The customization of the platform opens up plenty of other options depending on the use cases. The API layer is incredibly rich and makes integration of Qlik based visualization into web pages a simple and effective pattern. It's been very easy to use with a great community …
Qlik Sense is a fast tool to implement; you can have a functional dashboard in a few days, and the ETL processes are quite easy to build it. You can have the ROI in a short period of time.
Qlik Sense comes out as a superior product as well as more cost efficient than some of the other products we evaluated as a part of our Enterprise Business Intelligence stack. It offers unified view of our data and extensibility. Qlik Sense being the most interactive …
Qlik Sense is one of the best reporting systems. It is stronger than PBI and Tableau when speaking about complex KPIs. It is really similar to Microstrategy Analytics when you speak about obtained results, but it is easier to use, especially as it is more code-based. But is it …
Qlik Sense can easily integrate multiple data models to
visualize customer data. Tableau is easy to use—perhaps more manageable than Qlik—but
expensive. Microsoft BI was chosen because it was similar to previously used
We originally went with Qlik Sense because the desktop version used to be free for single users and was a very good proposition for us (we are a non-profit with a limited budget). However, from what I see, the functionality is comparable, and Qlik Sense stacks up well.
On the long run we will not stay with Qlik as the management chose to switch to the Microsoft suite. We think that this will not impact us as a team as both tools are worthy competitors
As soon as you want to pull data from two or more separate tables, Qlik Sense leaves the rest in the dust, since it does not require joins or complex transformations. Zoho CRM analytics are limited to the data located in the product itself. No external tables can be combined.
Other tools were not able to handle complex business requirements and performance was not too good with very huge volume data. we were required to maintain history, time-based data backups, and snapshots. Also, some of the tools were too costly compare to Qlik [Sense] solutions.
When it comes to working with large datasets out of the box, Qlik in my opinion is unrivaled amongst the competitor. However, the overall user experience and customization options available to developers require a lot of work. When compared to other options on the market, …
A well-suited scenario for using AWS Tensor Flow is when having a project with a geographically dispersed team, a client overseas and large data to use for training. AWS Tensor Flow is less appropriate when working for clients in regions where it hasn't been allowed yet for use. Since smaller clients are in regions where AWS Tensor Flow hasn't been allowed for use, and those clients traditionally don't have enough hardware, this situation deters a wider use of the tool.
Qlik Sense is a program whose purpose is to greatly improve all your operations and use of all data in an organic way. The mission will always be to increase the economic and commercial processes of the company in a short time. I recommended it for its high technology, which was Created for this area, the results are successful. We have noticed how it has increased relationships with our clients thanks to the credibility and security that we provide.
Amazon Elastic Compute Cloud (EC2) allows resizable compute capacity in the cloud, providing the necessary elasticity to provide services for both, small and medium-sized businesses.
Tensor Flow allows us to train our models much faster than in our on-premise equipment.
Most of the pre-trained models are easy to adapt to our clients' needs.
SageMaker isn't available in all regions. This is complicated for some clients overseas.
For larger instances, when using a GPU, it takes a while to talk to a customer service representative to ask for a limit increase. Given this, it's recommendable to ask in advance for a limit increase in more expensive and larger cases; otherwise, SageMaker will set the limit to zero by default.
Since the data has to be stored in S3 and copied to training, it doesn't allow to test and debug locally. Therefore, we have to wait a lot to check everything after every trail.
Not a lot of room for customization as we were used to in QlikView
UI and default navigation can be very clunky and not user friendly
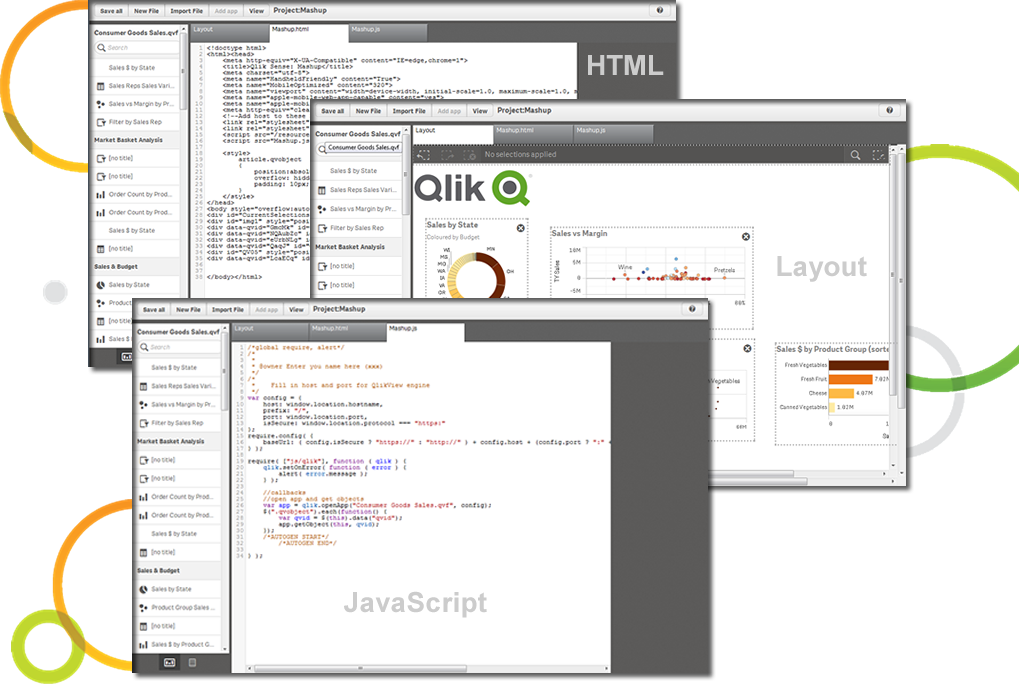
Although the backend is fantastic, the front end experience leaves a lot to be desired. As a developer you don't have a lot of options to customized your app unless you turn to Javascript, CSS and HTML. This is not a common stack you would find in most BI developers
Qlik Sense is a constantly improving it's software and working with its' users to make it better. They are great at keeping their users informed of progress and care about delivering a quality product
Qlik Sense has a better and easy to learn user interface compared with other analytics tool which always help us to create regular and adhoc reports within the stipulated time frame and can be easily refreshed at a scheduled time and sent to multiple stakeholders for timely update regarding the Key metrics indicator.
Qlik is great for companies with lots of business domains and departments because it scales well, especially if data that is reported is saved in SQL and similar structures. Its ease of use and good UI enables business units to create and manage their own reports. That removes a great burden of creating and managing/modifying these pages from the IT team. Overall, it's a win-win for both IT and business units.
Microsoft Azure is better than Amazon Tensor Flow because it provides easier and pre-built capabilities such as Anomaly Detection, Recommendation, and Ranking. AWS is better than IBM Watson ML Studio because it has direct and prebuilt clustering capabilities AWS, like IBM Watson ML Studio, has powerful built-in algorithms, providing a stronger platform when comparing it with MS Azure ML Services and Google ML Engine.
The customization of the platform opens up plenty of other options depending on the use cases. The API layer is incredibly rich and makes integration of Qlik based visualization into web pages a simple and effective pattern. It's been very easy to use with a great community made up of professionals. Qlik Sense has introduces artificial Intelligence into my data visualization and reporting activity.
The impact has undoubtedly been positive, it is difficult to quantify it, however in terms of effectiveness or efficiency I give it a 90%.
I don't give it 100% because to use the complete package you have to pay, and it's not that cheap and on the other hand because it has some deficiencies, such as technical support and some issues like windows that are not so friendly and easy to work with.