Dundas BI is a business intelligence and data visualization software that includes customizable dashboards, reporting, and visual data analytics. Dundas BI can be integrated into users’ existing business applications and its visualization and reporting tools can be customized to their needs.
N/A
Izenda
Score 10.0 out of 10
Small Businesses (1-50 employees)
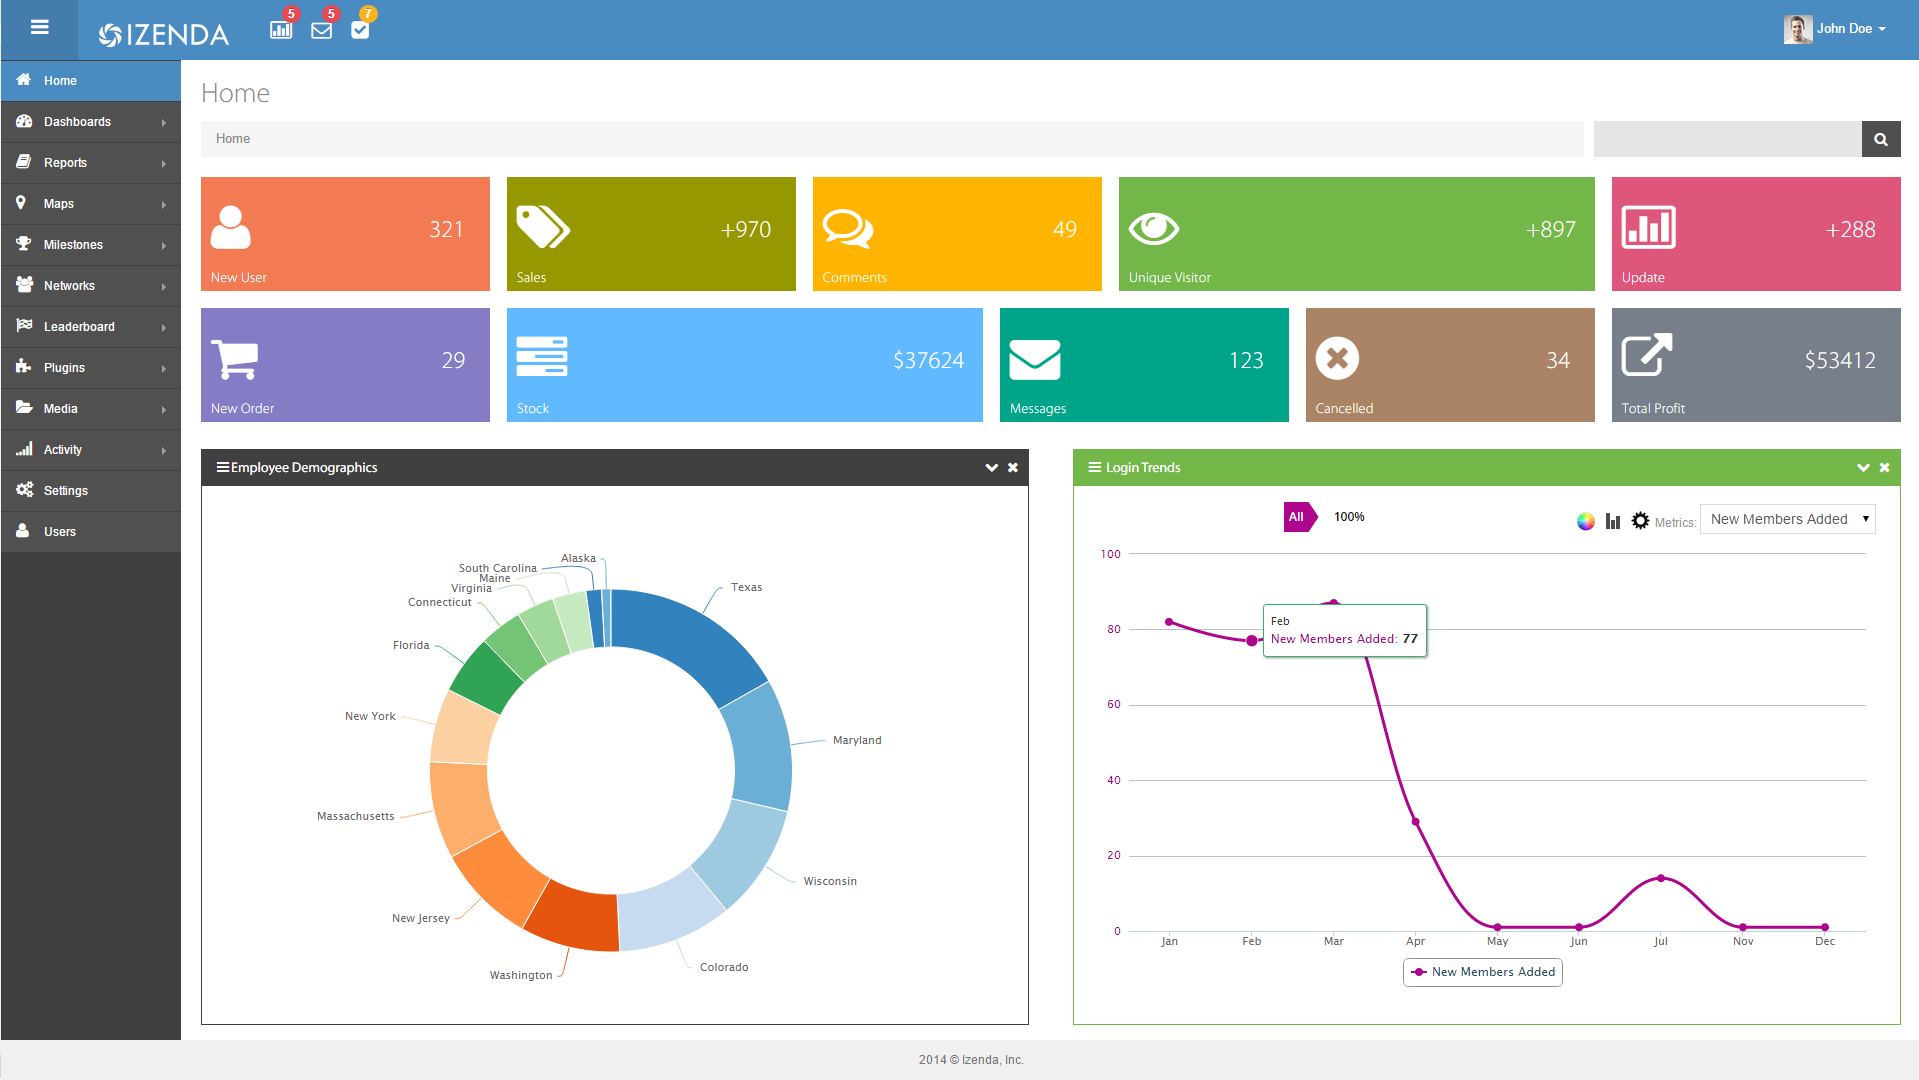
Izenda is a business intelligence software offering from Izenda.
N/A
Pricing
Dundas BI
Izenda
Editions & Modules
No answers on this topic
No answers on this topic
Offerings
Pricing Offerings
Dundas BI
Izenda
Free Trial
Yes
Yes
Free/Freemium Version
No
No
Premium Consulting/Integration Services
Yes
Yes
Entry-level Setup Fee
No setup fee
No setup fee
Additional Details
—
No per user or core fees, unlimited use licensing for production and non-production instances.
For all the scenarios I have so far worked on or I am currently working on, Dundas BI has proved to be more than adequate and apt to handle all of those. It is a very easy-to-use tool with quick shortcuts enabling you to prepare ad-hoc reports or dashboards in a matter of minutes.
With Izenda, we can offer our trusted users dashboards, generated custom reports, and ad-hoc reporting, right within our own operation. Integrating the Izenda tool directly into our usage meant that we were suitable to use a small corridor of Izenda as core functionality while reserving the more advanced sections of Izenda for guests willing to pay redundancy for the licensing.
Project organization from Development to Production, you get a production and development license but I think the best way to do it is with DEV and Prod project in the Production box. Use the development box for testing updates and really crazy things. With the Dev and Prod projects on the same box, you just publish from Dev to Prod and you are done. Users only have access to the Prod projects so no one can mess up what you are working on.
Security - If you have a hierarchy (subsidiaries, divisions, department, teams) and you want each group to see only their data, then Security hierarchies are for you!
Dependent filters! What's this you ask? Here is an example of how it can be used, in your company you have departments and who works for what department is in your database. You make a dashboard that has a department filter (only show these departments), a managers filter, and employee filter. Not every manager or employee is in multiple departments usually only one. With dependent filters you can say that the manager and employee filter are dependent on what is selected in the departments filter so when you go to filter them they only show the managers or employees that are part of that department, and you can even it do so employees are not only dependent on department but on manager as well. Then it gets even better as it can be done in reverse as well so when you select a manager then go to the department it only shows the departments he works for (there are better situations where this is more useful).
It is scriptable! From calculate columns, null replacements, button actions, load actions, hover over events there a way to do what you want.
They are constantly improving and listens to your suggestions.
User and tenant management is excellent. It is very simple to implement and easy to manage.
The configurability and customizability are excellent. We have access to all aspects of the system and have rebranded and configured single sign on. The users really like it.
Reports and visualizations work. There's lots of flexibility and users enjoy creating reports themselves.
Not too many cons for how we use the application. It really is easy and powerful. Very powerful.
Licensing is one thing that could be looked into. It is simple, but a little confusing. For example, if I get a license today, but a new release comes out tomorrow, it seems that the license doesn't work with the new release. Maybe that is by design, but it would be nice to clearly understand.
We are still in the implementation phase, but so far we are finding it to be easy to use and learn. The eLearning courses that they have made available for free, as well as User Forums and other training videos have made even difficult concepts easier to understand.
With the help of Izenda, we are able to build a mature foundation that users can quickly customize to their needs. Once permissions are layered in, we can simply use the same report and only show fields a specific user has access to.
We have bi-weekly calls with our Success Manager, as well as access to support as needed. Any question that I have had, multiple people have been willing and able to jump on a call to talk me through it, or send an email with the solution
Per dollar spent, it offers the widest range of features of the tools that we evaluated. It offers lots of options for how to configure your environment, though they are not always intuitive to figure out. Having an ETL layer was a must have for us, as well as the ability to host to secure HIPAA compliance. It is not a replacement for ad hoc reporting, but does a great job of creating parameterized reports and dashboards that look great.
We compared to other end user tools like Qlik, Tableau and Power BI. These tools are very refined but not positioned for OEM/Embedded use cases. The closest we came was logi and Birst and the price and business model of Izenda was much more appealing