Synergies is a cognitive application service provider that combines business knowledge, artificial intelligence technology, and software development. Their mission is to help businesses through their digital transformation journey, become leaders and innovators in their industries by unlocking the power of data in the hands of business users and decision makers. Their product, JarviX, is an AnalyticOps Platform . JarviX uses NLP…
N/A
Microsoft Power BI
Score 8.4 out of 10
N/A
Microsoft Power BI is a visualization and data discovery tool from Microsoft. It allows users to convert data into visuals and graphics, visually explore and analyze data, collaborate on interactive dashboards and reports, and scale across their organization with built-in governance and security.
In comparison to JarviX, Power BI offers a lot of customization for reporting purposes. However, JarviX has the advantage of saving time and built-in algorithmic analyses that integrate data visualization. JarviX’s also has a huge advantage in its natural language query …
Microsoft Power BI
No answer on this topic
Features
JarviX
Microsoft Power BI
BI Standard Reporting
Comparison of BI Standard Reporting features of Product A and Product B
JarviX
7.6
2 Ratings
7% below category average
Microsoft Power BI
8.3
196 Ratings
2% above category average
Pixel Perfect reports
8.21 Ratings
8.3167 Ratings
Customizable dashboards
7.32 Ratings
8.7195 Ratings
Report Formatting Templates
7.31 Ratings
8.0178 Ratings
Ad-hoc Reporting
Comparison of Ad-hoc Reporting features of Product A and Product B
JarviX
7.8
2 Ratings
3% below category average
Microsoft Power BI
8.0
194 Ratings
0% below category average
Drill-down analysis
7.12 Ratings
8.3191 Ratings
Formatting capabilities
7.31 Ratings
7.8191 Ratings
Integration with R or other statistical packages
9.11 Ratings
7.4143 Ratings
Report sharing and collaboration
7.72 Ratings
8.4189 Ratings
Report Output and Scheduling
Comparison of Report Output and Scheduling features of Product A and Product B
JarviX
7.8
1 Ratings
5% below category average
Microsoft Power BI
8.0
187 Ratings
2% below category average
Publish to Web
9.11 Ratings
8.2177 Ratings
Publish to PDF
7.31 Ratings
8.1172 Ratings
Report Versioning
6.41 Ratings
7.7144 Ratings
Report Delivery Scheduling
8.21 Ratings
8.2147 Ratings
Delivery to Remote Servers
8.21 Ratings
7.9110 Ratings
Data Discovery and Visualization
Comparison of Data Discovery and Visualization features of Product A and Product B
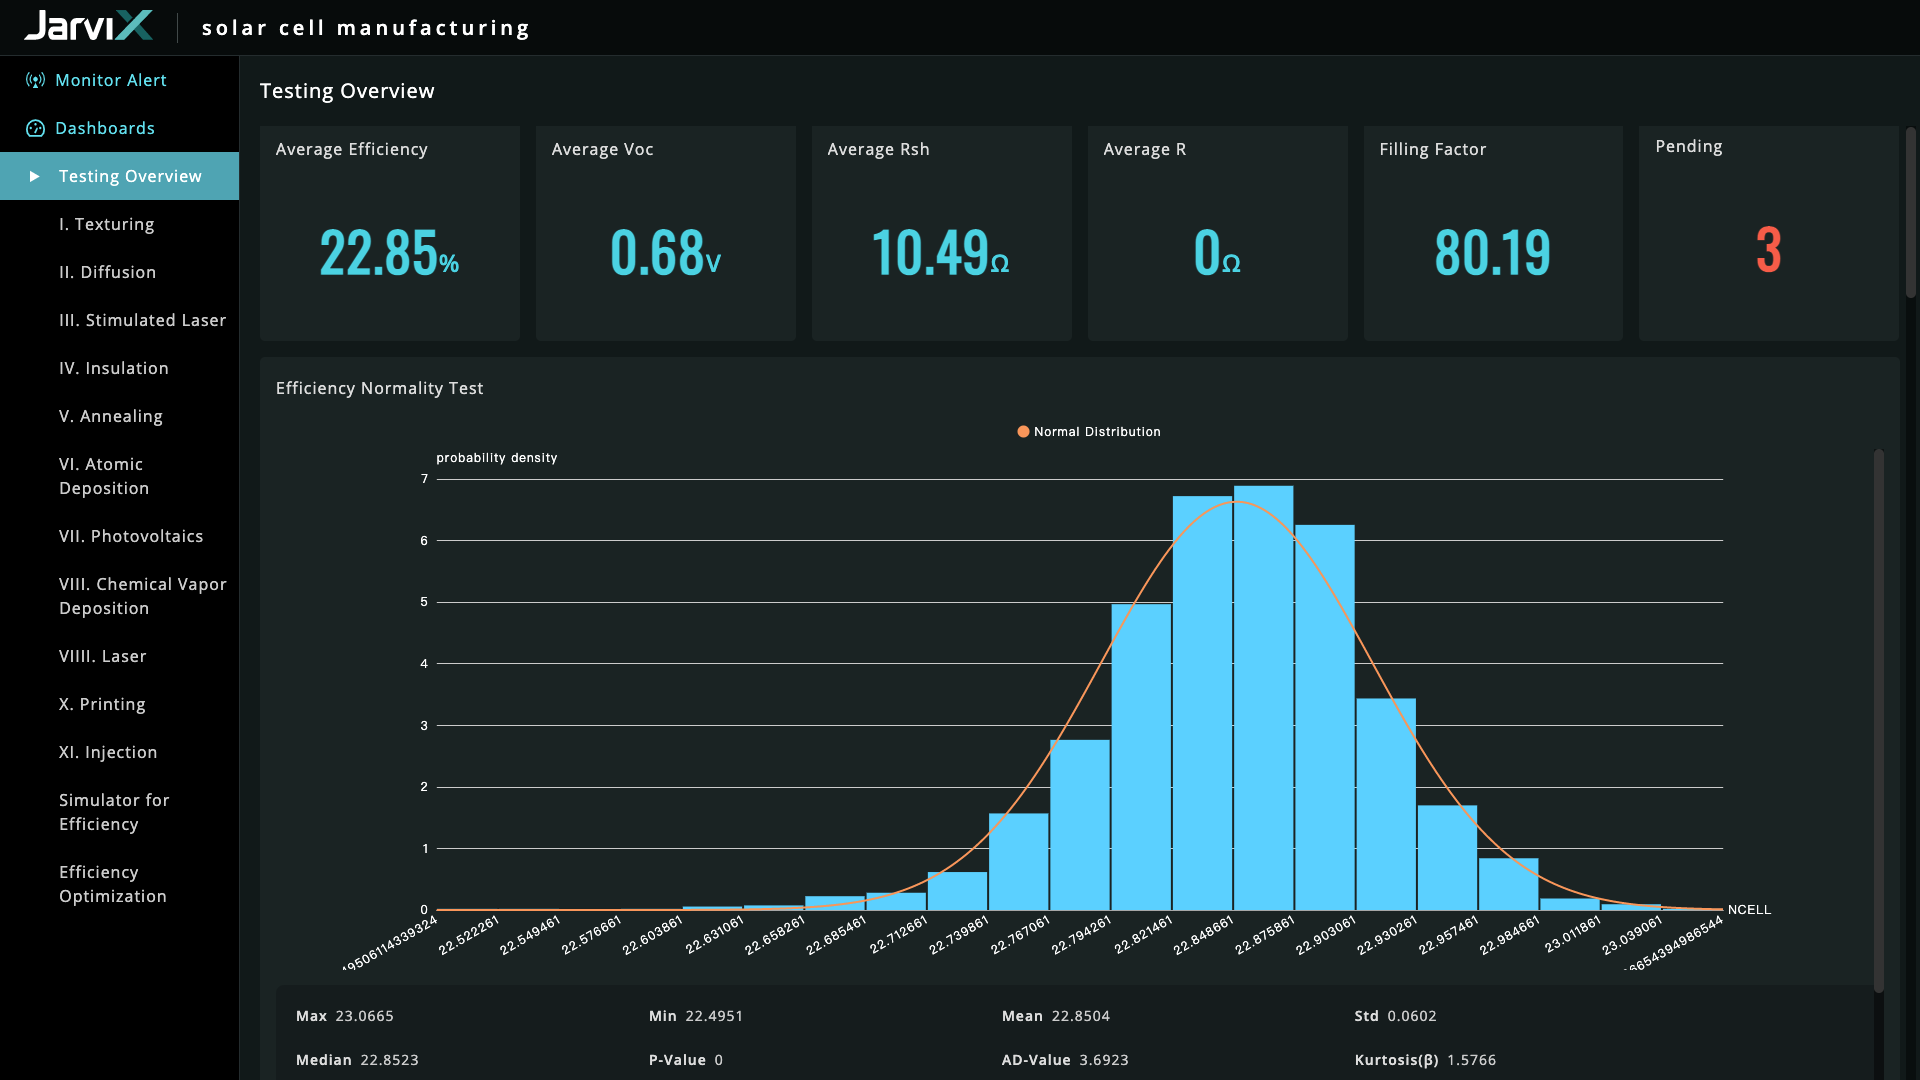
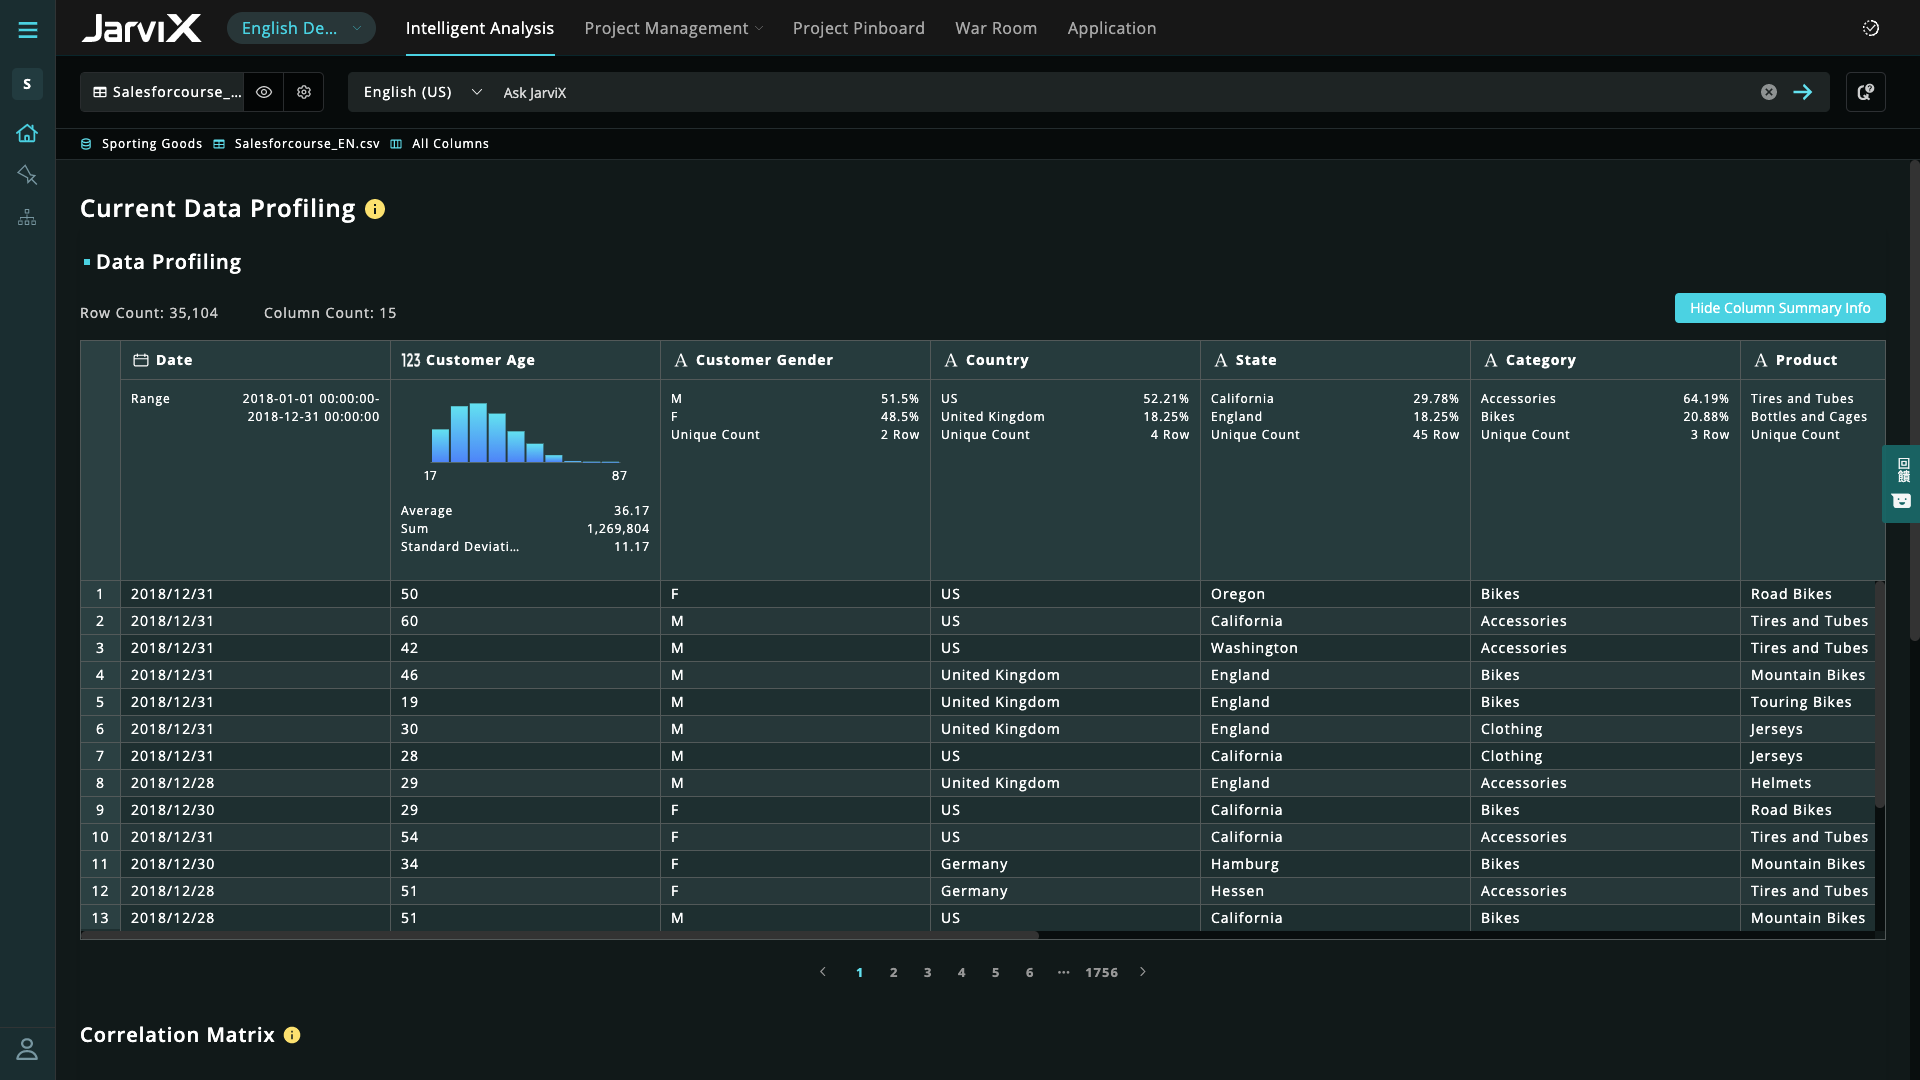
JarviX is very good at data integration, creating charts and reports for data visualization. It is really impressive that Jarvix can let our marketing team know the number of members living in a specific area in seconds. In addition, the product manager from Synergies is willing to help us with all problems we encounter. I accidentally changed one of the settings in a data table which threw the existing dashboard into chaos. However, after assistance from the product manager, we were able to successfully bring the data back to normal.
Has significantly improved collation of data and visualisation especially with business across Europe. Has given me the ability to see the Site availability at the click of a button to see which Site is in the "money" and seize opportunities based on Market data
Options for data source connections are immense. Not just which sources, but your options for *how* the data is brought in.
Constant updates (this is both good and bad at times).
User friendliness. I can get the data connections set up and draft some quick visuals, then release to the target audience and let them expand on it how they want to.
There should be more flexibility in changing the data tables uploaded into JarviX. For example, it should enable users to edit the syntax of the table or change the data format of the columns without affecting the existing dashboard and charts already created using that data table.
Microsoft Power BI is an excellent and scalable tool. It has a learning curve, but once you get past that, the sky is the limit and you can build from the most simple to the most complex dashboards. I have built everything from simple reports with only a few data points to complex reports with many pages and advanced filtering.
Automating reporting has reduced manual data processing by 50-70%, freeing up analysts for higher-value tasks. A finance team that previously spent 20+ hours per week on Excel-based reports now does it in minutes with Microsoft Power BI's automated Real-time dashboards have shortened decision cycles by 30-40%, enabling leadership to react quickly to sales trends, operational bottlenecks, and customer behavior.
It is a fantastic tool, you can do almost everything related with data and reports, it is a perfect substitutive of Power Point and Excel with a high evolution and flexibility, and also it is very friendly and easy to share. I think all companies should have Power BI (or other BI tool) in their software package and if they are in the MS Suite, for sure Power BI should be the one due to all the benefits of the MS ecosystem.
Tableau and Power BI. Obviously, they are not in the same category. Tableau and Power BI only provide data visualizations plus a little bit of analytics. JarviX not only provides data exploration, so you can find out what the problem is, as well as model management and App builder. If you only look for a dashboard, yes BI is probably enough, but if you constantly feel lacking actionable insights for actual implementations of improvements, JarviX is the choice for you.
Microsoft Power BI is free. If I didn't want to create a custom platform (i.e. my organization insisted on an existing platform that I *had* to use), I'd use Microsoft Power BI. For any start-up or SMB, I'd just use Claude & Grok to build it quickly, also for free. Would not pay for Tableau or Sigma anymore. Not worth it at all.
I think the best part of JarviX is that we can get the analysis results in several minutes. We spent lots of time making reports and managing our data in the past. All in all, it helps us save the time, cost, and labor of managing data.