PingPlotter vs. Splunk Infrastructure Monitoring
PingPlotter vs. Splunk Infrastructure Monitoring
| Product | Rating | Most Used By | Product Summary | Starting Price |
|---|---|---|---|---|
 PingPlotter | N/A | PingPlotter is a graphical traceroute and ping tool that visualizes network performance in a way that makes identifying the source of problems quicker and easier for everyone from online gamers and video streamers to VoIP admins and IT pros. Features for remote deployment, network monitoring, scripting, and a web interface are included along with several additional capabilities. | $0 per user | |
 Splunk Infrastructure Monitoring | N/A | SignalFX is Real-Time Cloud Monitoring and Observability for Infrastructure, Microservices and Applications. SignalFX was acquired by Splunk in August 2019. SignalFX Infrastructure Monitoring provides real-time cloud monitoring and observability platform for infrastructure, microservices and DevOps. A new SignalFX product, SignalFx Microservices APM, was released March 2020 to detect issues, provide real-time app troubleshooting, and future-proof expectations. | $15 per month |
| PingPlotter | Splunk Infrastructure Monitoring | |||||||||||||||
|---|---|---|---|---|---|---|---|---|---|---|---|---|---|---|---|---|
| Editions & Modules |
| No answers on this topic | ||||||||||||||
| Offerings |
| |||||||||||||||
| Entry-level Setup Fee | No setup fee | No setup fee | ||||||||||||||
| Additional Details | — | — | ||||||||||||||
| More Pricing Information | ||||||||||||||||
| PingPlotter | Splunk Infrastructure Monitoring | |
|---|---|---|
| Top Pros | ||
| Top Cons |
|
| PingPlotter | Splunk Infrastructure Monitoring | ||||||||||||||||||
|---|---|---|---|---|---|---|---|---|---|---|---|---|---|---|---|---|---|---|---|
| Network Performance Monitoring |
|
| PingPlotter | Splunk Infrastructure Monitoring | |
|---|---|---|
| Small Businesses |  NinjaOne Score 9.2 out of 10 |  Veeam ONE Score 8.5 out of 10 |
| Medium-sized Companies |  Nmap Score 8.9 out of 10 |  IBM Instana Score 8.9 out of 10 |
| Enterprises | Nmap Score 8.9 out of 10 | IBM Instana Score 8.9 out of 10 |
| All Alternatives | View all alternatives | View all alternatives |
| PingPlotter | Splunk Infrastructure Monitoring | |
|---|---|---|
| Likelihood to Recommend | 9.5 (19 ratings) | 8.3 (24 ratings) |
| Likelihood to Renew | - (0 ratings) | 6.4 (1 ratings) |
| Usability | - (0 ratings) | 7.3 (1 ratings) |
| Support Rating | 9.0 (1 ratings) | - (0 ratings) |
| PingPlotter | Splunk Infrastructure Monitoring | |
|---|---|---|
| Likelihood to Recommend | Pingman Tools
|  Splunk
 David Williams CIO (Chief Information Officer) |
| Pros | Pingman Tools
| Splunk
 DJ Enriquez Lead DevOps Engineer |
| Cons | Pingman Tools
 Martin Vandepas Hardware Engineer | Splunk
|
| Likelihood to Renew | Pingman Tools No answers on this topic | Splunk
|
| Usability | Pingman Tools No answers on this topic | Splunk
|
| Support Rating | Pingman Tools
 Fraser Clark Network Engineer | Splunk No answers on this topic |
| Alternatives Considered | Pingman Tools
| Splunk
|
| Return on Investment | Pingman Tools
| Splunk
|
| ScreenShots | PingPlotter Screenshots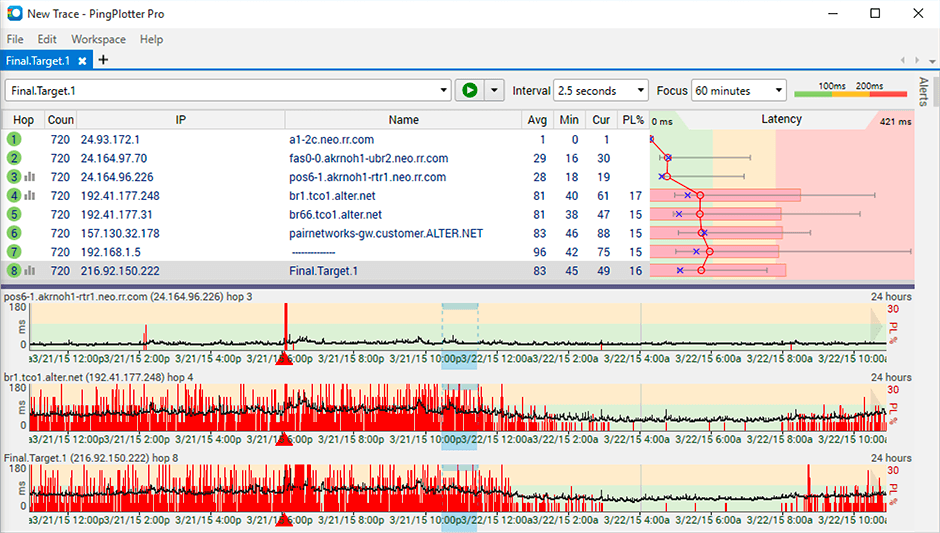   | Splunk Infrastructure Monitoring Screenshots |