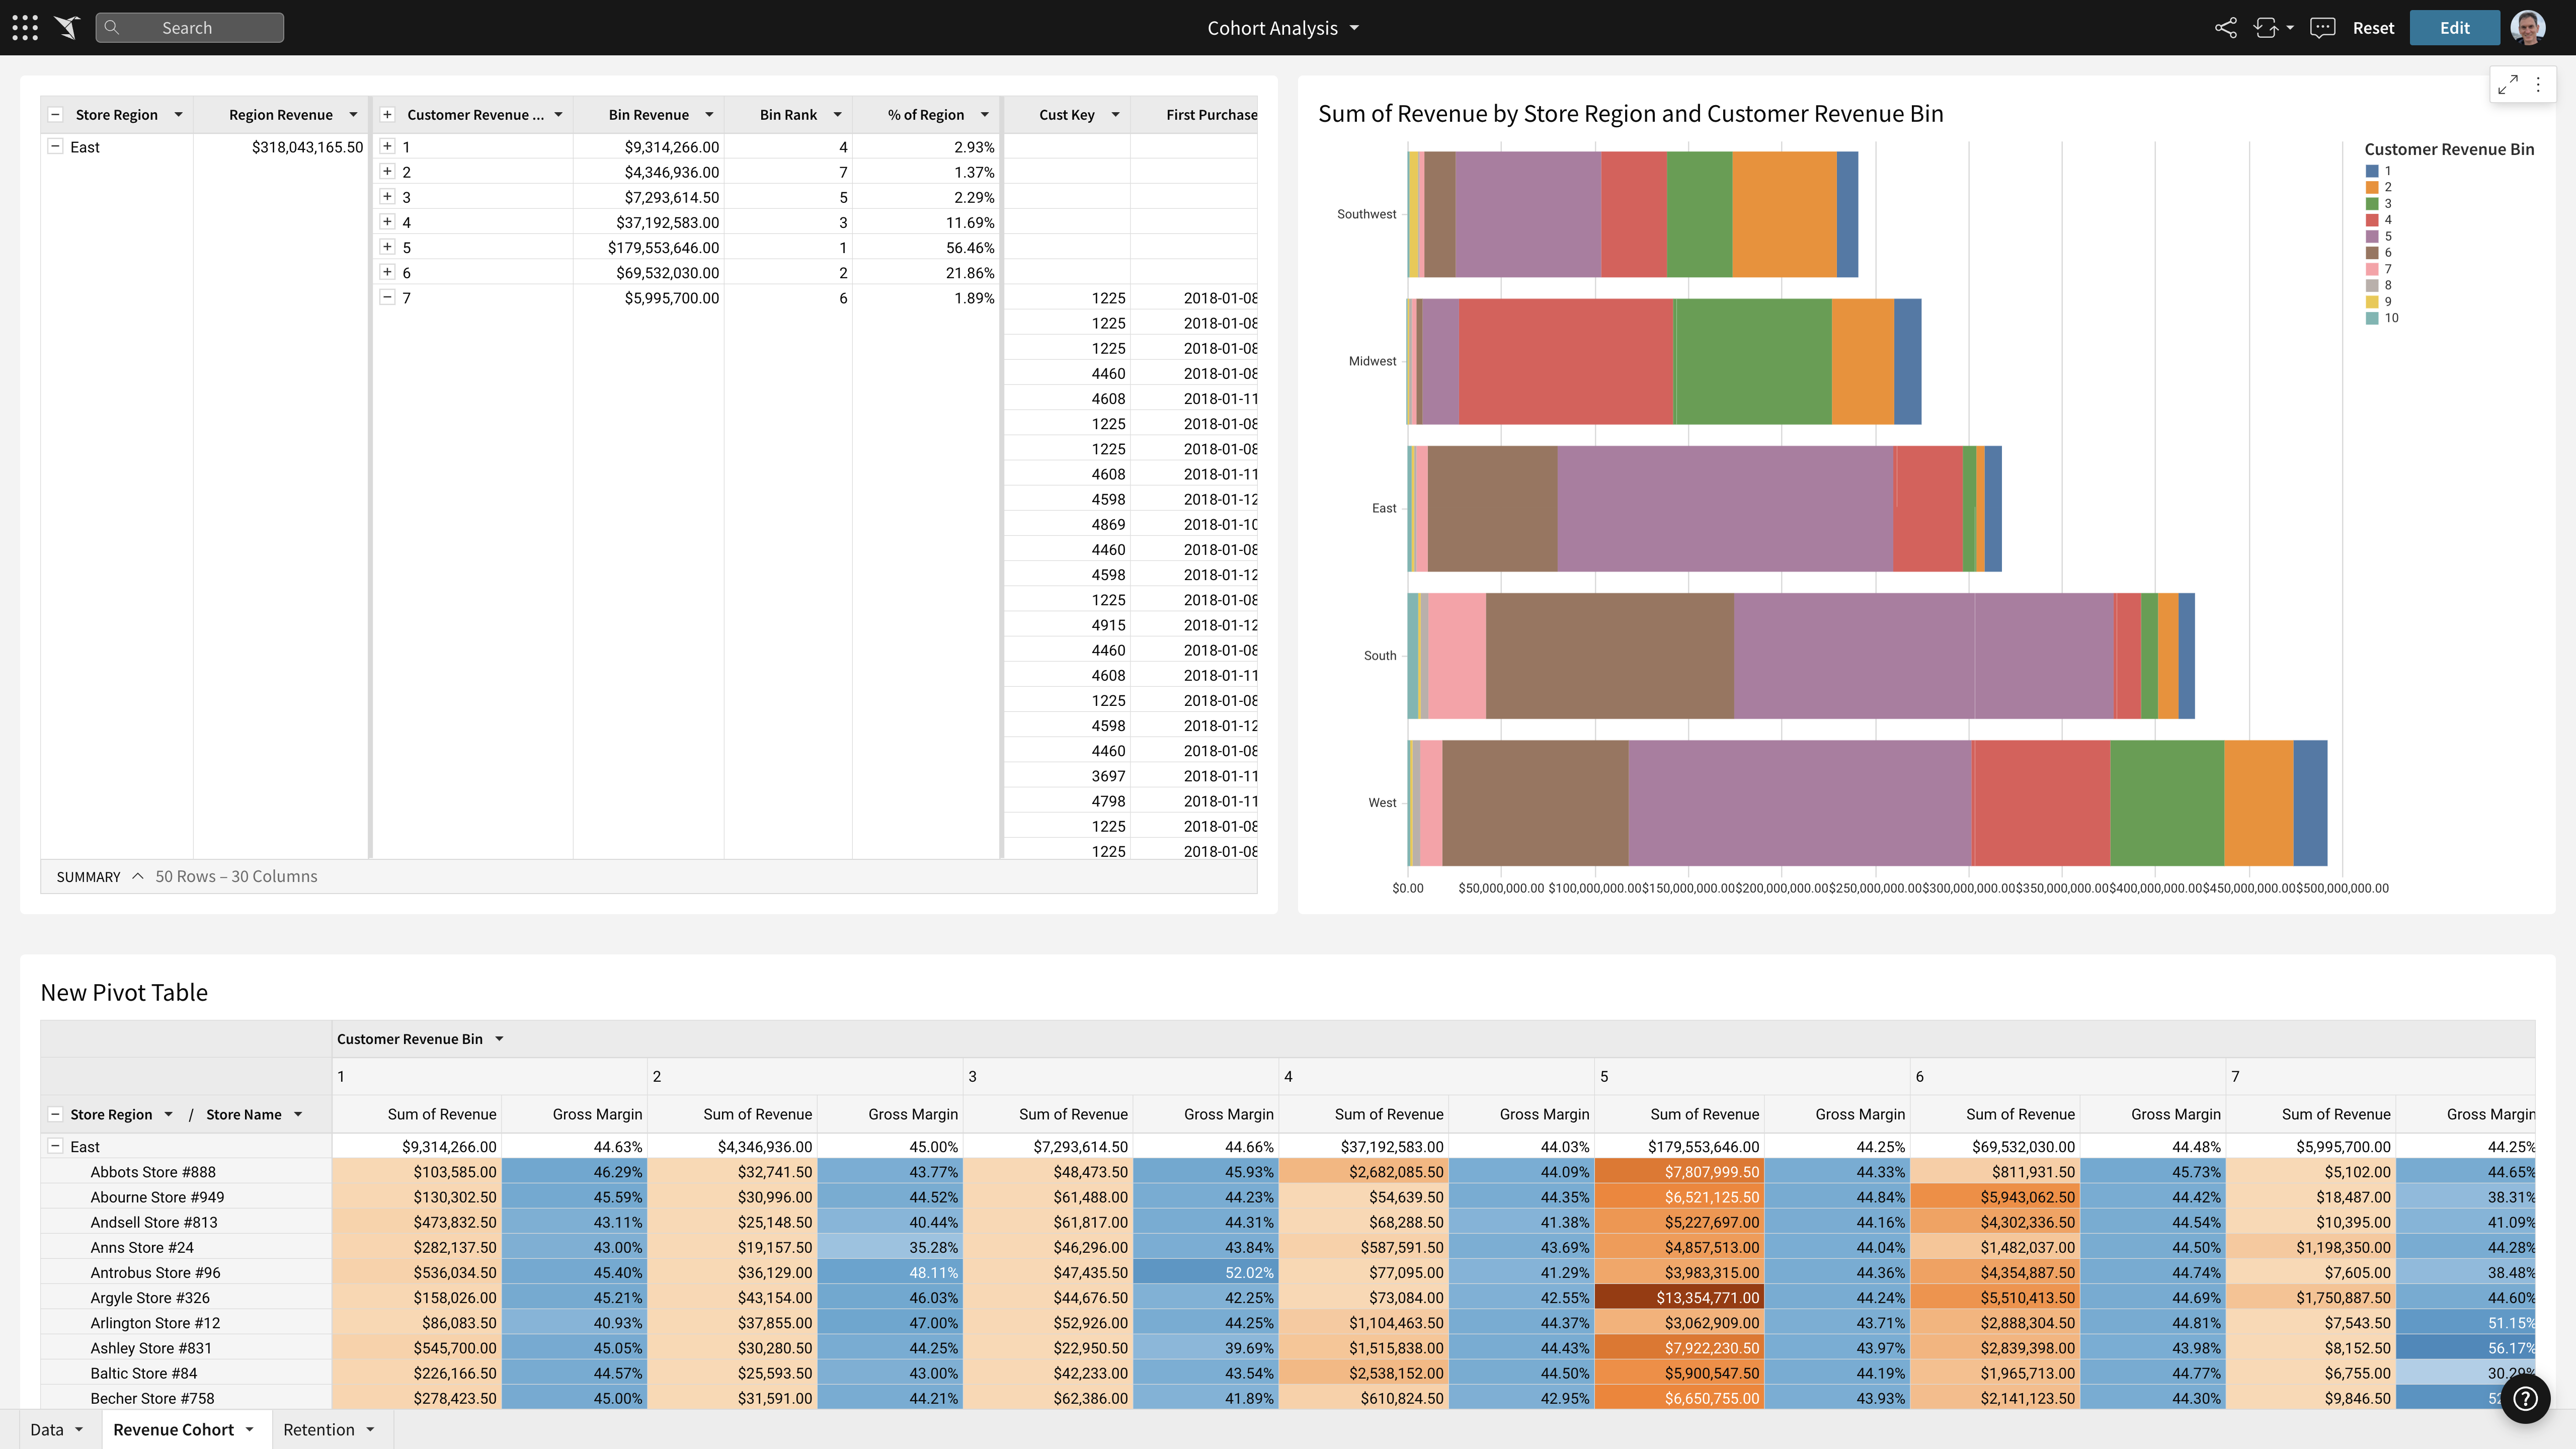
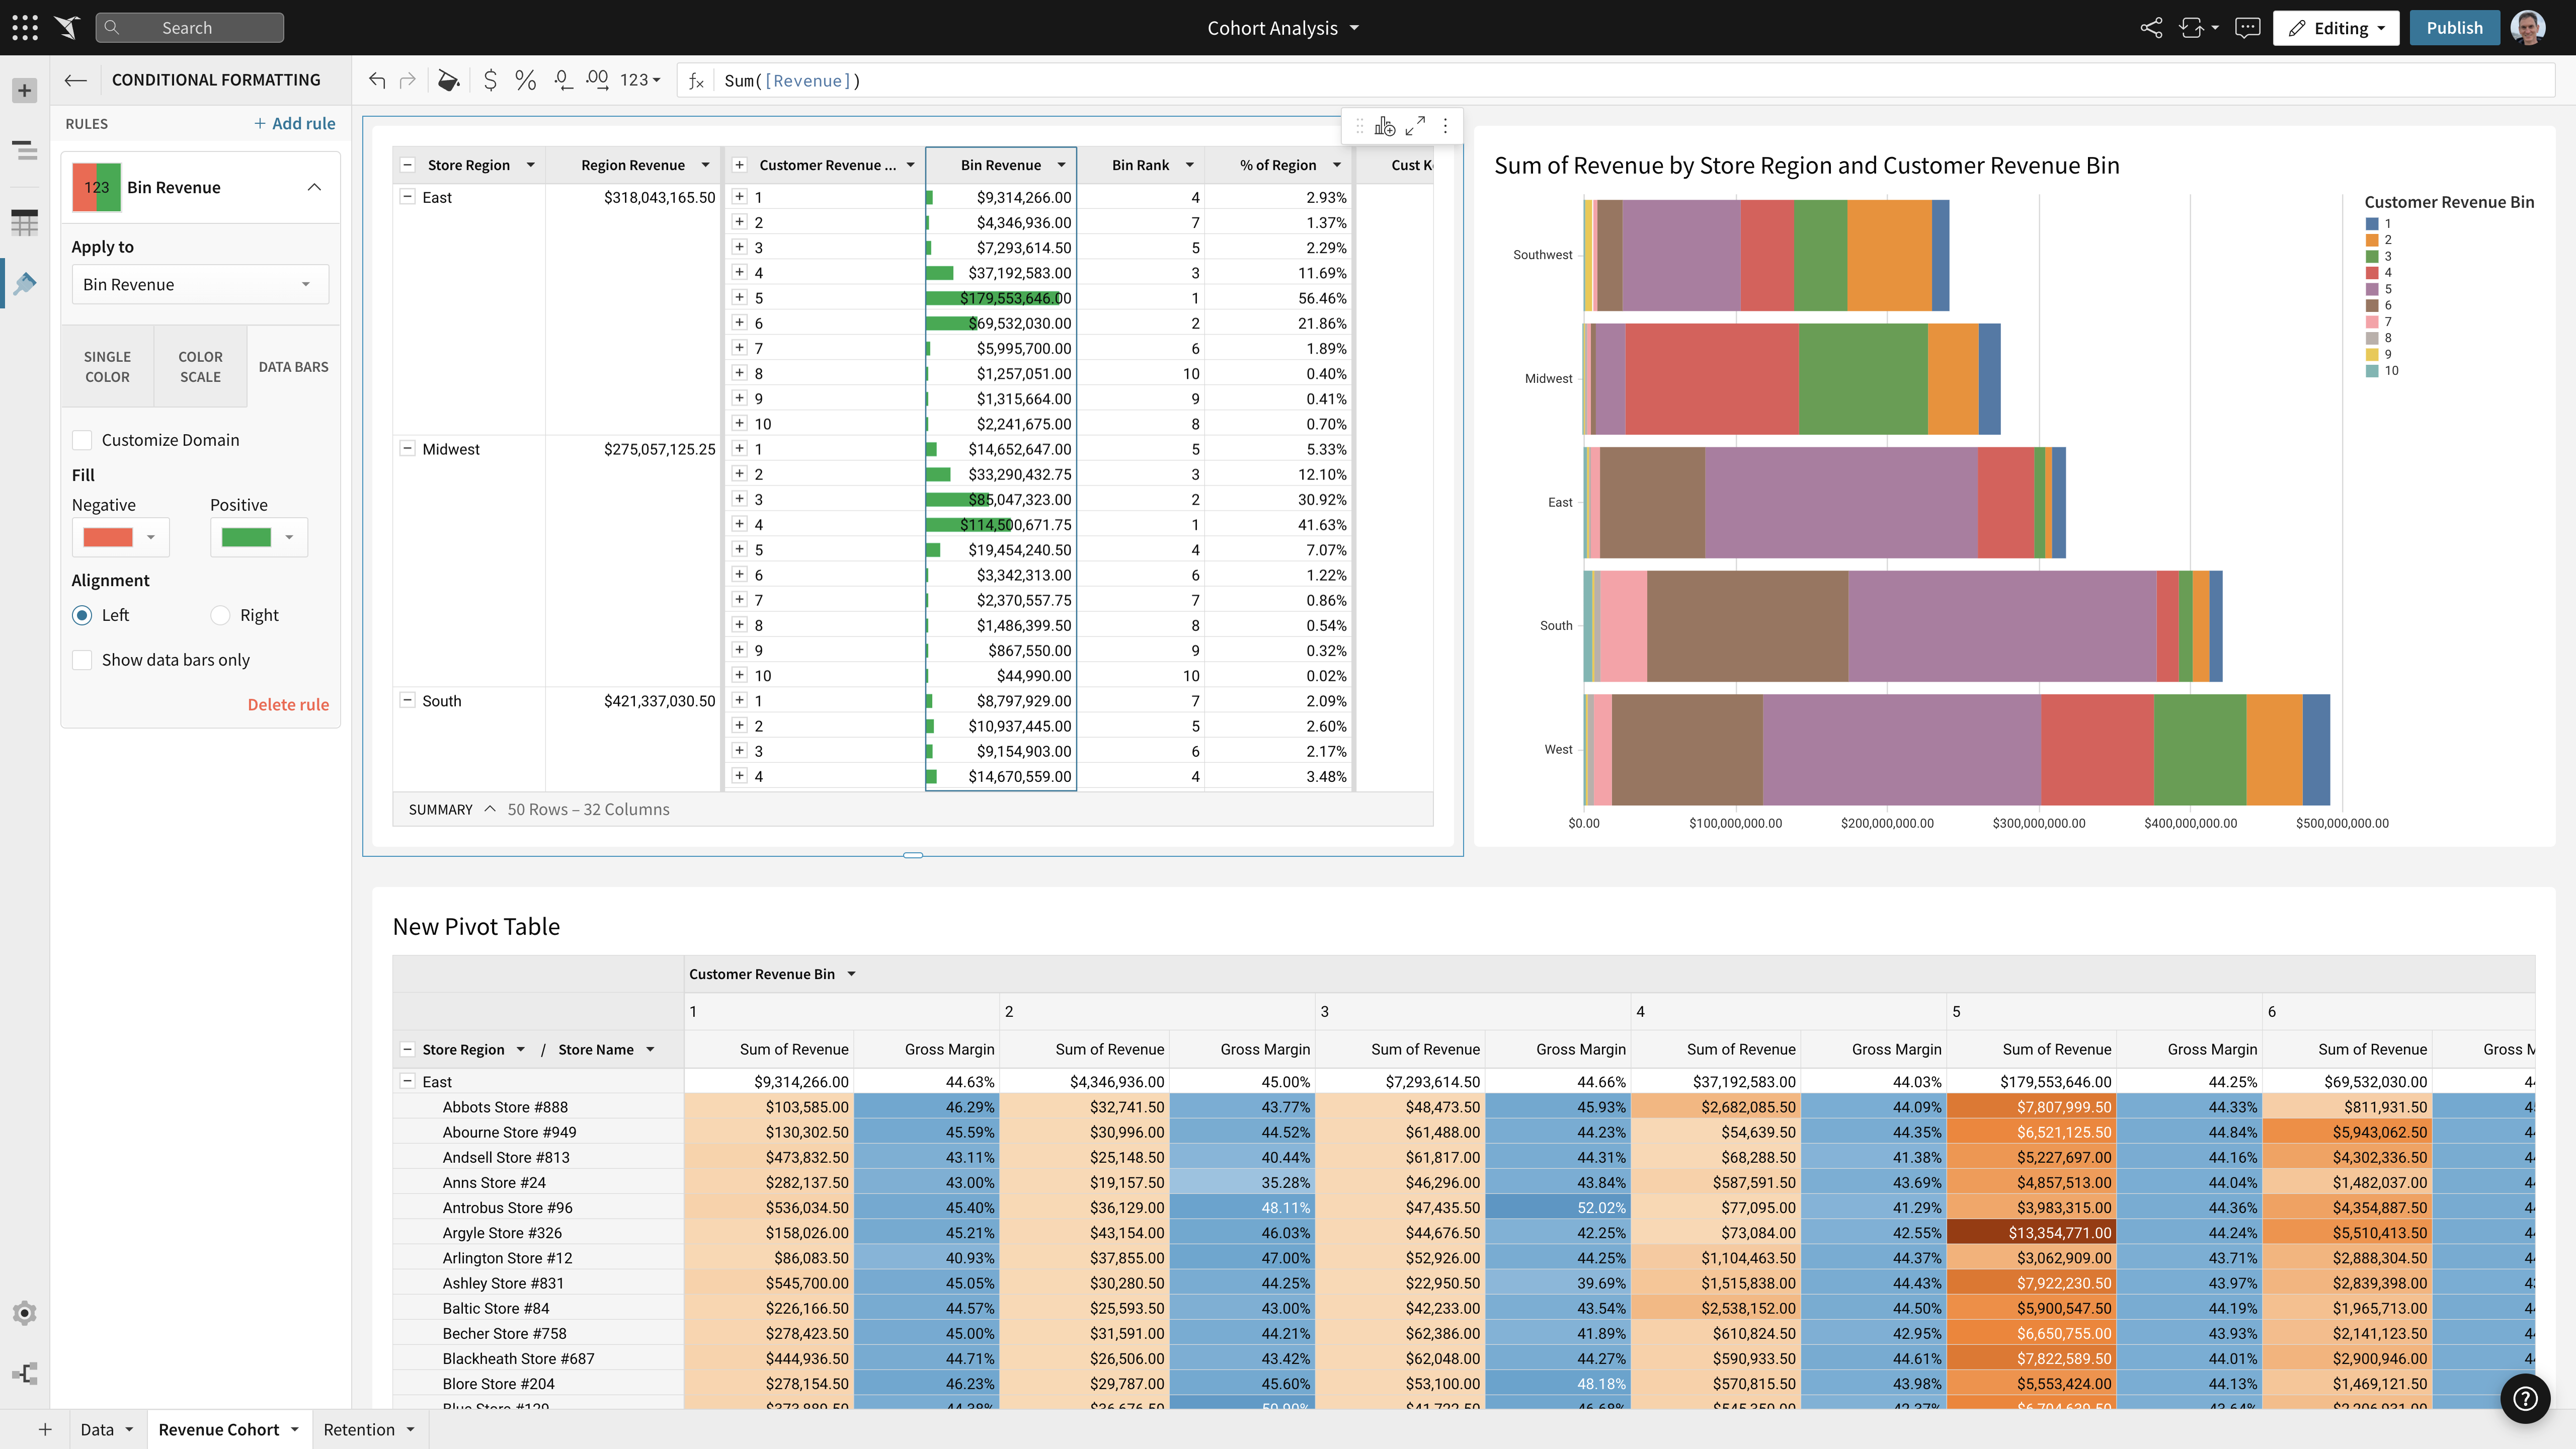
Sigma Computing headquartered in San Francisco provides a suite of data services such as code free data modeling, data search and explorating, and related BI and data visualization services.
N/A
Tableau Public
Score 8.9 out of 10
N/A
Tableau Public is a free edition of the Desktop product. With this edition, data can only be published to the Tableau public website and does not allow work to be saved or exported locally.
Sigma Computing had better functionality and is beginner friendly. While Tableau is a more well known product, Sigma Computing has a better user interface that is easier to comprehend for those without a non-technical background. This makes it easier to showcase dashboards to …
sorta in the middle. One thing that differs than Domo or power bi, is that those softwares bring in the data into the platform, instead of how sigma runs a query against our data warehouse each time a user interacts with the dashboard (there is some small caching, so not always)
Its a great tool to have. The ability to come in the morning and by using the report being able see how the day will go. Seeing the goal and the current inventory and also to be able to adjust as the day goes on. With the report updates the report as changes to the inventory happen live or if any issues arise. being able to see that live and being to react quickly.
Tableau public is the best platform to build dashboards for your personal profile and share with recruiters. It's always good to keep ourselves updated on the latest features, create sample dashboards and save them to a personal profile. Tableau public is free and doesn't need any subscription. anyone can create an account and start building reports.
Data visualization: lots of different options, including bar, scatter, pie, waterfall charts to explore relationships between variables, and to present findings/trends to different teams
Integrates readily with limited, though different data sources: TXT, CSV, TDE, Access
Exports reports for review of different dashboards: client-ready/team-ready, with a clean and tidy presentation in PDF format (or hardcopy)
Viewer level license is quite limited. These users can't download data or even add filters on datasets. Something to keep in mind.
Directly querying the underlying data warehouse will lead to increased usage. Not a big deal on something like Redshift, but your Snowflake consumption will increase, potentially by a lot.
Tableau Public (both Desktop and Server) like their "for a fee" counterparts offer very easy to learn and use tools to transform data into pictures and gain insights into your data. Most organizations report a reduction in development time of 10x vs. other similar tools, due to the intuitive user interface. That said, with Tableau Public, published workbooks are "disconnected" from the underlying data sources and require periodic updates when the data changes. Users are limited to 1 Gb of storage space per user ID and password as well.
I would like to see better options for public sharing of visualizations and data from within the "for a fee" products as more and more organizations are moving in the direction of data sharing with partners and their communities.
Sigma has helped us a lot and has become an integral part of our daily workflow. It would be difficult to switch to another platform and have to rebuild the numerous metrics and performance reports that we have already established
It's free, right? I'll keep using the free version. So the real question to ask is this? Will I pay $999 for the Personal version or $1,999 for the Professional? Yikes! That is a big stretch. I'm not sure about that. The product comparison chart is at: http://www.tableausoftware.com/public/comparison
It has a clean and modern interface. However, it is not completely intuitive. I think it would be better and easier to navigate with more Windows style drop down menus and/or tabls. There is a significant learning curve, but that may be due in part to the technical nature of this type of software tool.
Tableau public is a great training tool to understand the basics of Tableau before buying it. A great tool to extend Excel's visualization and to publish data for others. Not useful for anything you need secure. No ability to access databases. Static information only.
Support team is helpful in answering questions and providing help with using the UI. There are knowledgeable people within the support team. There are also good online support tools. There are significant community support resources available. There is however lack of a live support. It would be useful to have live phone number or chat to use.
Start at the end and work backward. Identify the business case / issue and questions the end users have, then identify the data needed, and where to get it.
Sigma is by far the best. It is easiest to learn and easiest to use on a day to day basis. I never have to wait for dashboards to load and it's very easy to understand the variables that are going into my visualizations. Best of all I can manipulate the data within Sigma very easily. In these other platforms data manipulation is difficult or must be done in the data warehouse
Google Charts/Drive is sufficient for simpler data sets, but it does not integrate with other web platforms and the visualization does not look as professional. I'm not aware of any other competitors that offer the same package as Microsoft.
Monitoring health of cloud platform has allowed the company to anticipate issues before they affect customers – Sigma prompted us building a canary monitoring process that provides customer container health.
Customer success has used an activity report to discover customers running runaway processes that they were unaware of, creating an alert to contact the customer and prevent an embarrassing situation.
Customer success uses the activity report to prompt conversations regarding increases or declines in behavior that led to increasing contract limits or addressing churn concerns.