AppNeta vs. Splunk Infrastructure Monitoring

Overview
ProductRatingMost Used ByProduct SummaryStarting Price
AppNeta
Score 9.0 out of 10
Enterprise companies (1,001+ employees)
AppNeta provides performance monitoring solutions for distributed, cloud-connected, digital enterprises. AppNeta’s SaaS-based solutions give IT teams application and network performance data, allowing them to constantly monitor user experience across any application, network, data center or cloud.N/A
Splunk Infrastructure Monitoring
Score 8.7 out of 10
N/A
SignalFX is Real-Time Cloud Monitoring and Observability for Infrastructure, Microservices and Applications. SignalFX was acquired by Splunk in August 2019. SignalFX Infrastructure Monitoring provides real-time cloud monitoring and observability platform for infrastructure, microservices and DevOps. A new SignalFX product, SignalFx Microservices APM, was released March 2020 to detect issues, provide real-time app troubleshooting, and future-proof expectations.
$15
per month
Pricing
AppNetaSplunk Infrastructure Monitoring
Editions & Modules
No answers on this topic
Offerings
Pricing Offerings
AppNetaSplunk Infrastructure Monitoring
Free Trial
NoYes
Free/Freemium Version
NoNo
Premium Consulting/Integration Services
NoNo
Entry-level Setup FeeNo setup feeNo setup fee
Additional Details
More Pricing Information
Best Alternatives
AppNetaSplunk Infrastructure Monitoring
Small Businesses
SolarWinds Pingdom
SolarWinds Pingdom
Score 7.6 out of 10
Veeam ONE
Veeam ONE
Score 8.5 out of 10
Medium-sized Companies
Cisco ThousandEyes
Cisco ThousandEyes
Score 9.0 out of 10
IBM Instana
IBM Instana
Score 8.9 out of 10
Enterprises
Nexthink
Nexthink
Score 9.1 out of 10
IBM Instana
IBM Instana
Score 8.9 out of 10
All AlternativesView all alternativesView all alternatives
User Ratings
AppNetaSplunk Infrastructure Monitoring
Likelihood to Recommend
6.0
(2 ratings)
8.3
(24 ratings)
Likelihood to Renew
-
(0 ratings)
6.4
(1 ratings)
Usability
-
(0 ratings)
7.3
(1 ratings)
Support Rating
5.0
(1 ratings)
-
(0 ratings)
User Testimonials
AppNetaSplunk Infrastructure Monitoring
Likelihood to Recommend
Broadcom
AppNeta is awesome for getting site-to-site statistics or trying to find out why at 3 am every night, this server loses connectivity to another server in a different data center. But we have found the multiple bugs in the hardware hard to deal with when the devices are a 4-hour plane ride away and require someone to console into the device.
Read full review
Splunk
Splunk Infrastructure Monitoring is well suited for any complicated environment where you have apps and servers across multiple clouds and platforms and products. If you have a data centre where all your apps and servers are in one single network, you could probably get away with older solutions. But for any modern, complex, hybrid-cloud microservices environment, Splunk Infrastructure Monitoring is a must-have.
Read full review
Pros
Broadcom
  • AppNeta provides detailed application availability & uptime.
  • AppNeta provides great longitudinal data regarding how the applications perform including an overall grade or "AppDex."
  • AppNeta sends notifications of service downtime that aids in technical dispatch.
Read full review
Splunk
  • SignalFX handles historical metric aggregation exceptionally well, providing a multifaceted approach to event detection based on anomalies.
  • SignalFX's cost is incredibly flexible with their pricing model of DPM (data-point per minute) vs the traditional "per host" model that most monitoring SaaS use.
  • SignalFX support is responsive and knowledgeable, very eager to help solve your immediate problems.
  • SignalFX integrations is vast and constantly growing, making adoption easy even when multiple different open-source technologies are used in your stack.
Read full review
Cons
Broadcom
  • Hardware has a lot of bugs.
  • Auto-updates cannot be turned off on the hardware, causing blips in monitoring.
Read full review
Splunk
  • Better integration with our clients (native mobile clients SDKs will be great).
  • A way to easily tag filters and move them across metrics/formula.
  • Alert system to easy false [alarm] and hard to configure.
  • Be able to have group more dimensions (and have more values on each).
Read full review
Likelihood to Renew
Broadcom
No answers on this topic
Splunk
Good: Stable system with low error rate Easy to use for simple use cases Bad: UI is not very clear for complex usage Mobile view (when logged in from phone) is bad No library for .net
Read full review
Usability
Broadcom
No answers on this topic
Splunk
I find that learning the interface can take some time. We need a better show-and-tell on how the Teams pages, Dashboard Groups, Dashboards and charts delay. Advance SignalFlow is sometimes hard to build. Some better samples of advanced SignalFlow would be helpful. For example, Splunk SPL has a vast resource of examples.
Read full review
Support Rating
Broadcom
Timely support is one of AppNeta's strong suits. But the ability to develop permeant fixes for issues within there product is where they lack.
Read full review
Splunk
No answers on this topic
Alternatives Considered
Broadcom
We currently use Nagios/GroundWork and Cacti to perform network monitoring. AppNeta's UI is far superior.
Read full review
Splunk
They’re not for the same purpose but we’re using NewRelic and Honeycomb for monitoring purposes. NewRelic is used for HTTP client monitoring for system related throughput, error, database and external client monitoring. Honeycomb is used to monitor actual HTTP request/response values. Splunk [Infrastructure Monitoring] is used for real-time application related throughout and error monitoring.
Read full review
Return on Investment
Broadcom
  • A reduction in network outages and length of network outages.
  • More detailed post outage investigation available.
Read full review
Splunk
  • Reduced downtime.
  • Caused us to get a lot of spam when we redeployed apps and old instances stopped sending metrics. Muting alerts solves this, but people often forget to do it or do it incorrectly.
  • Helped us find historical info about instances/apps.
Read full review
ScreenShots

AppNeta Screenshots

Screenshot of a visualization for monitoring what apps are in use on a network.Screenshot of AppNeta's in-depth diagnostics, used by IT Ops to identify the root cause of network and app performance issues.Screenshot of the enhanced Selenium scripting that can be used for web synthetic monitoring to benchmark and alert on performance for business-critical SaaS apps.Screenshot of monitoring of the actual application path with multi-protocol route determination for TCP, UDP and ICMP. Key network metrics can be tracked, like Latency, Loss, Capacity and Jitter continuously with AppNeta.Screenshot of how AppNeta correlates poor performance per host and--with Active Directory--with users.Screenshot of monitoring the usage of a network for recreational apps to see when they're stealing bandwidth from your business critical apps. Users can segment by location or app to drill into more details across the entire AppNeta Performance Manager dataset.

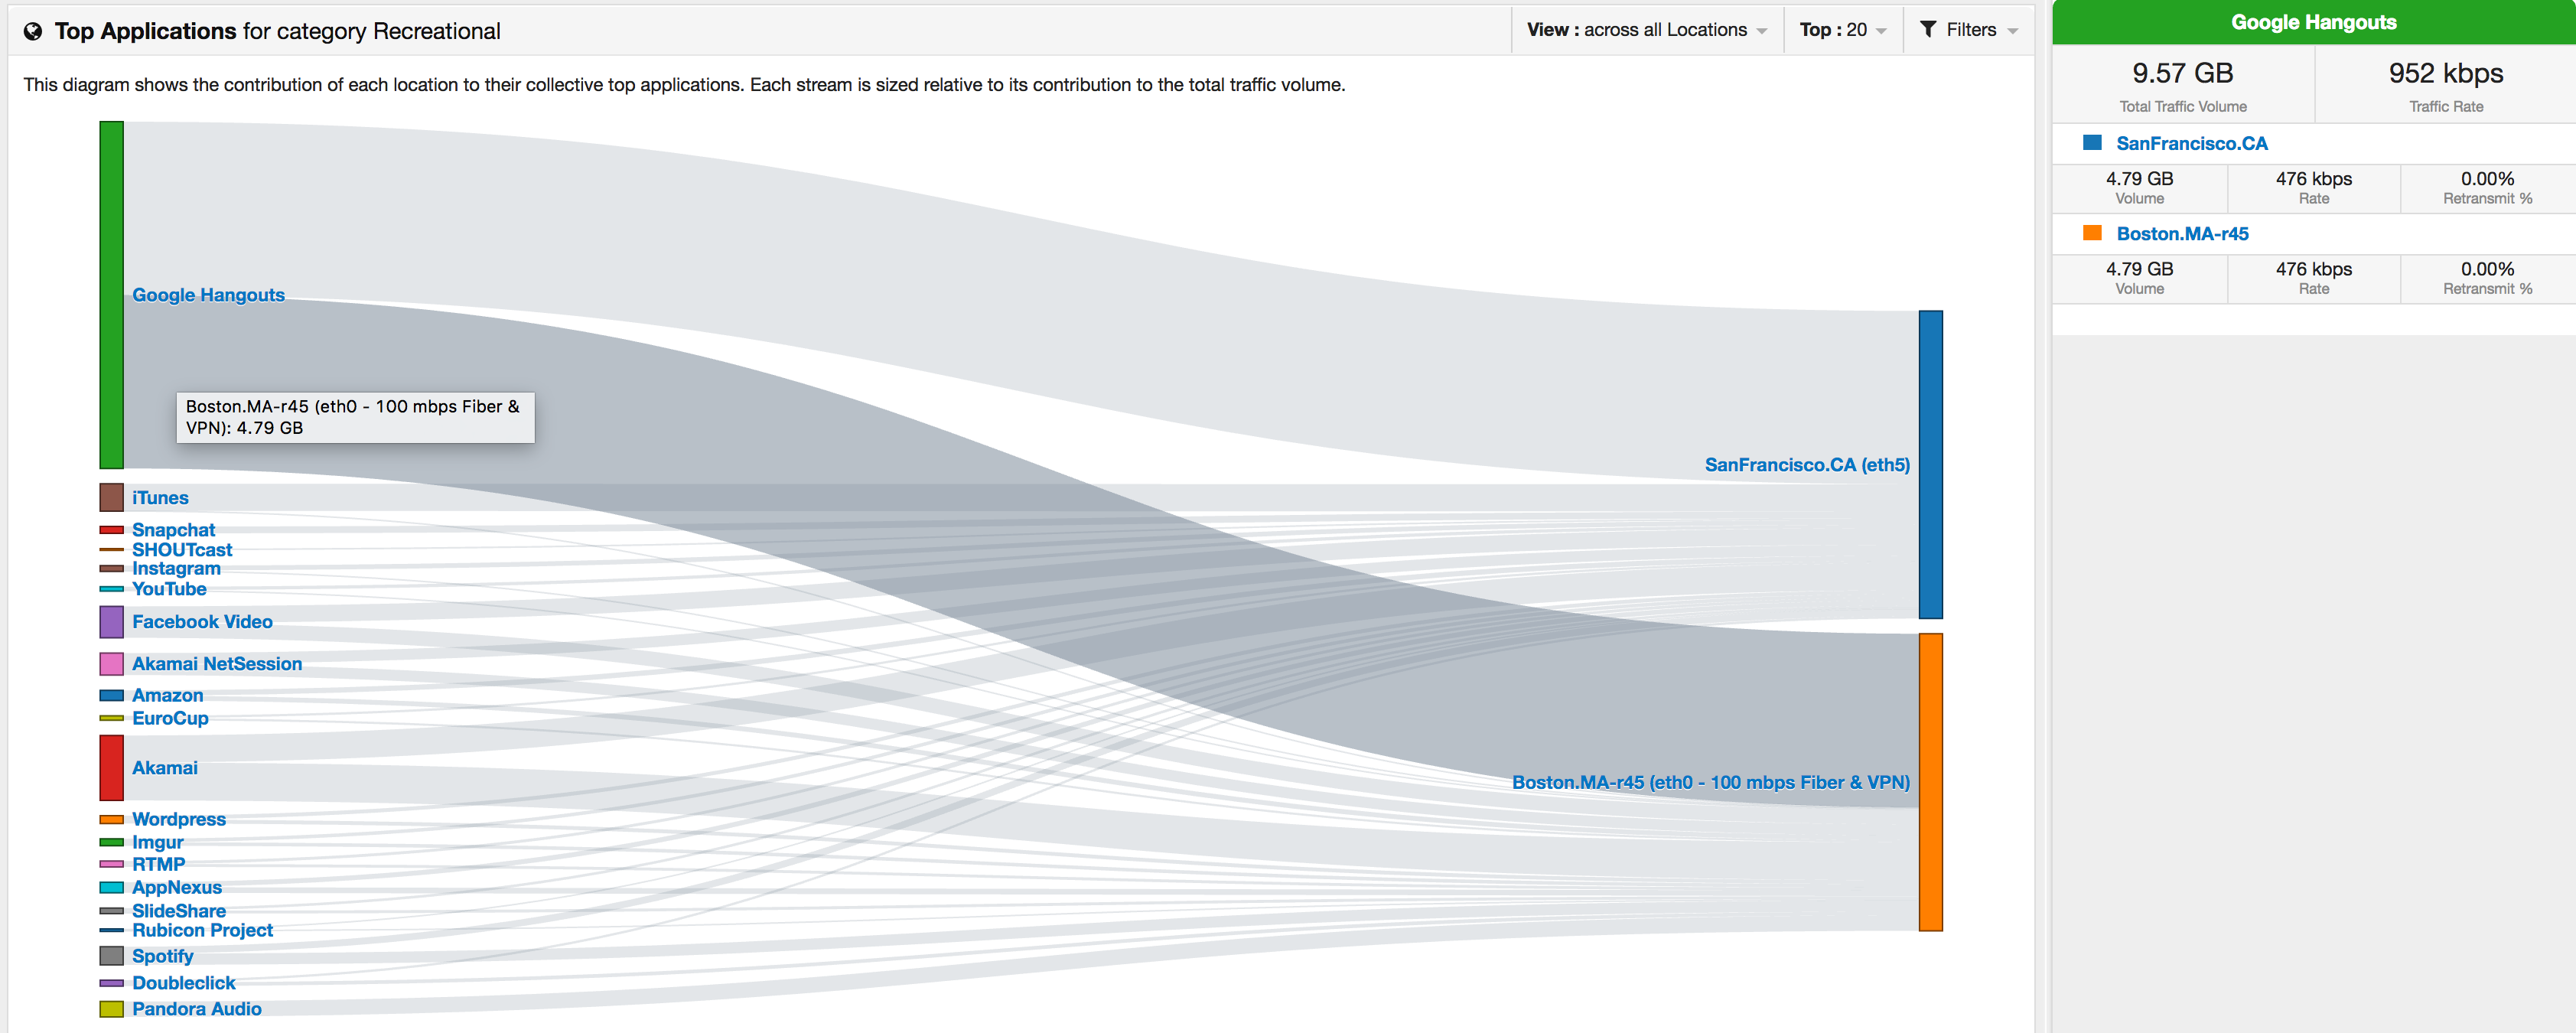
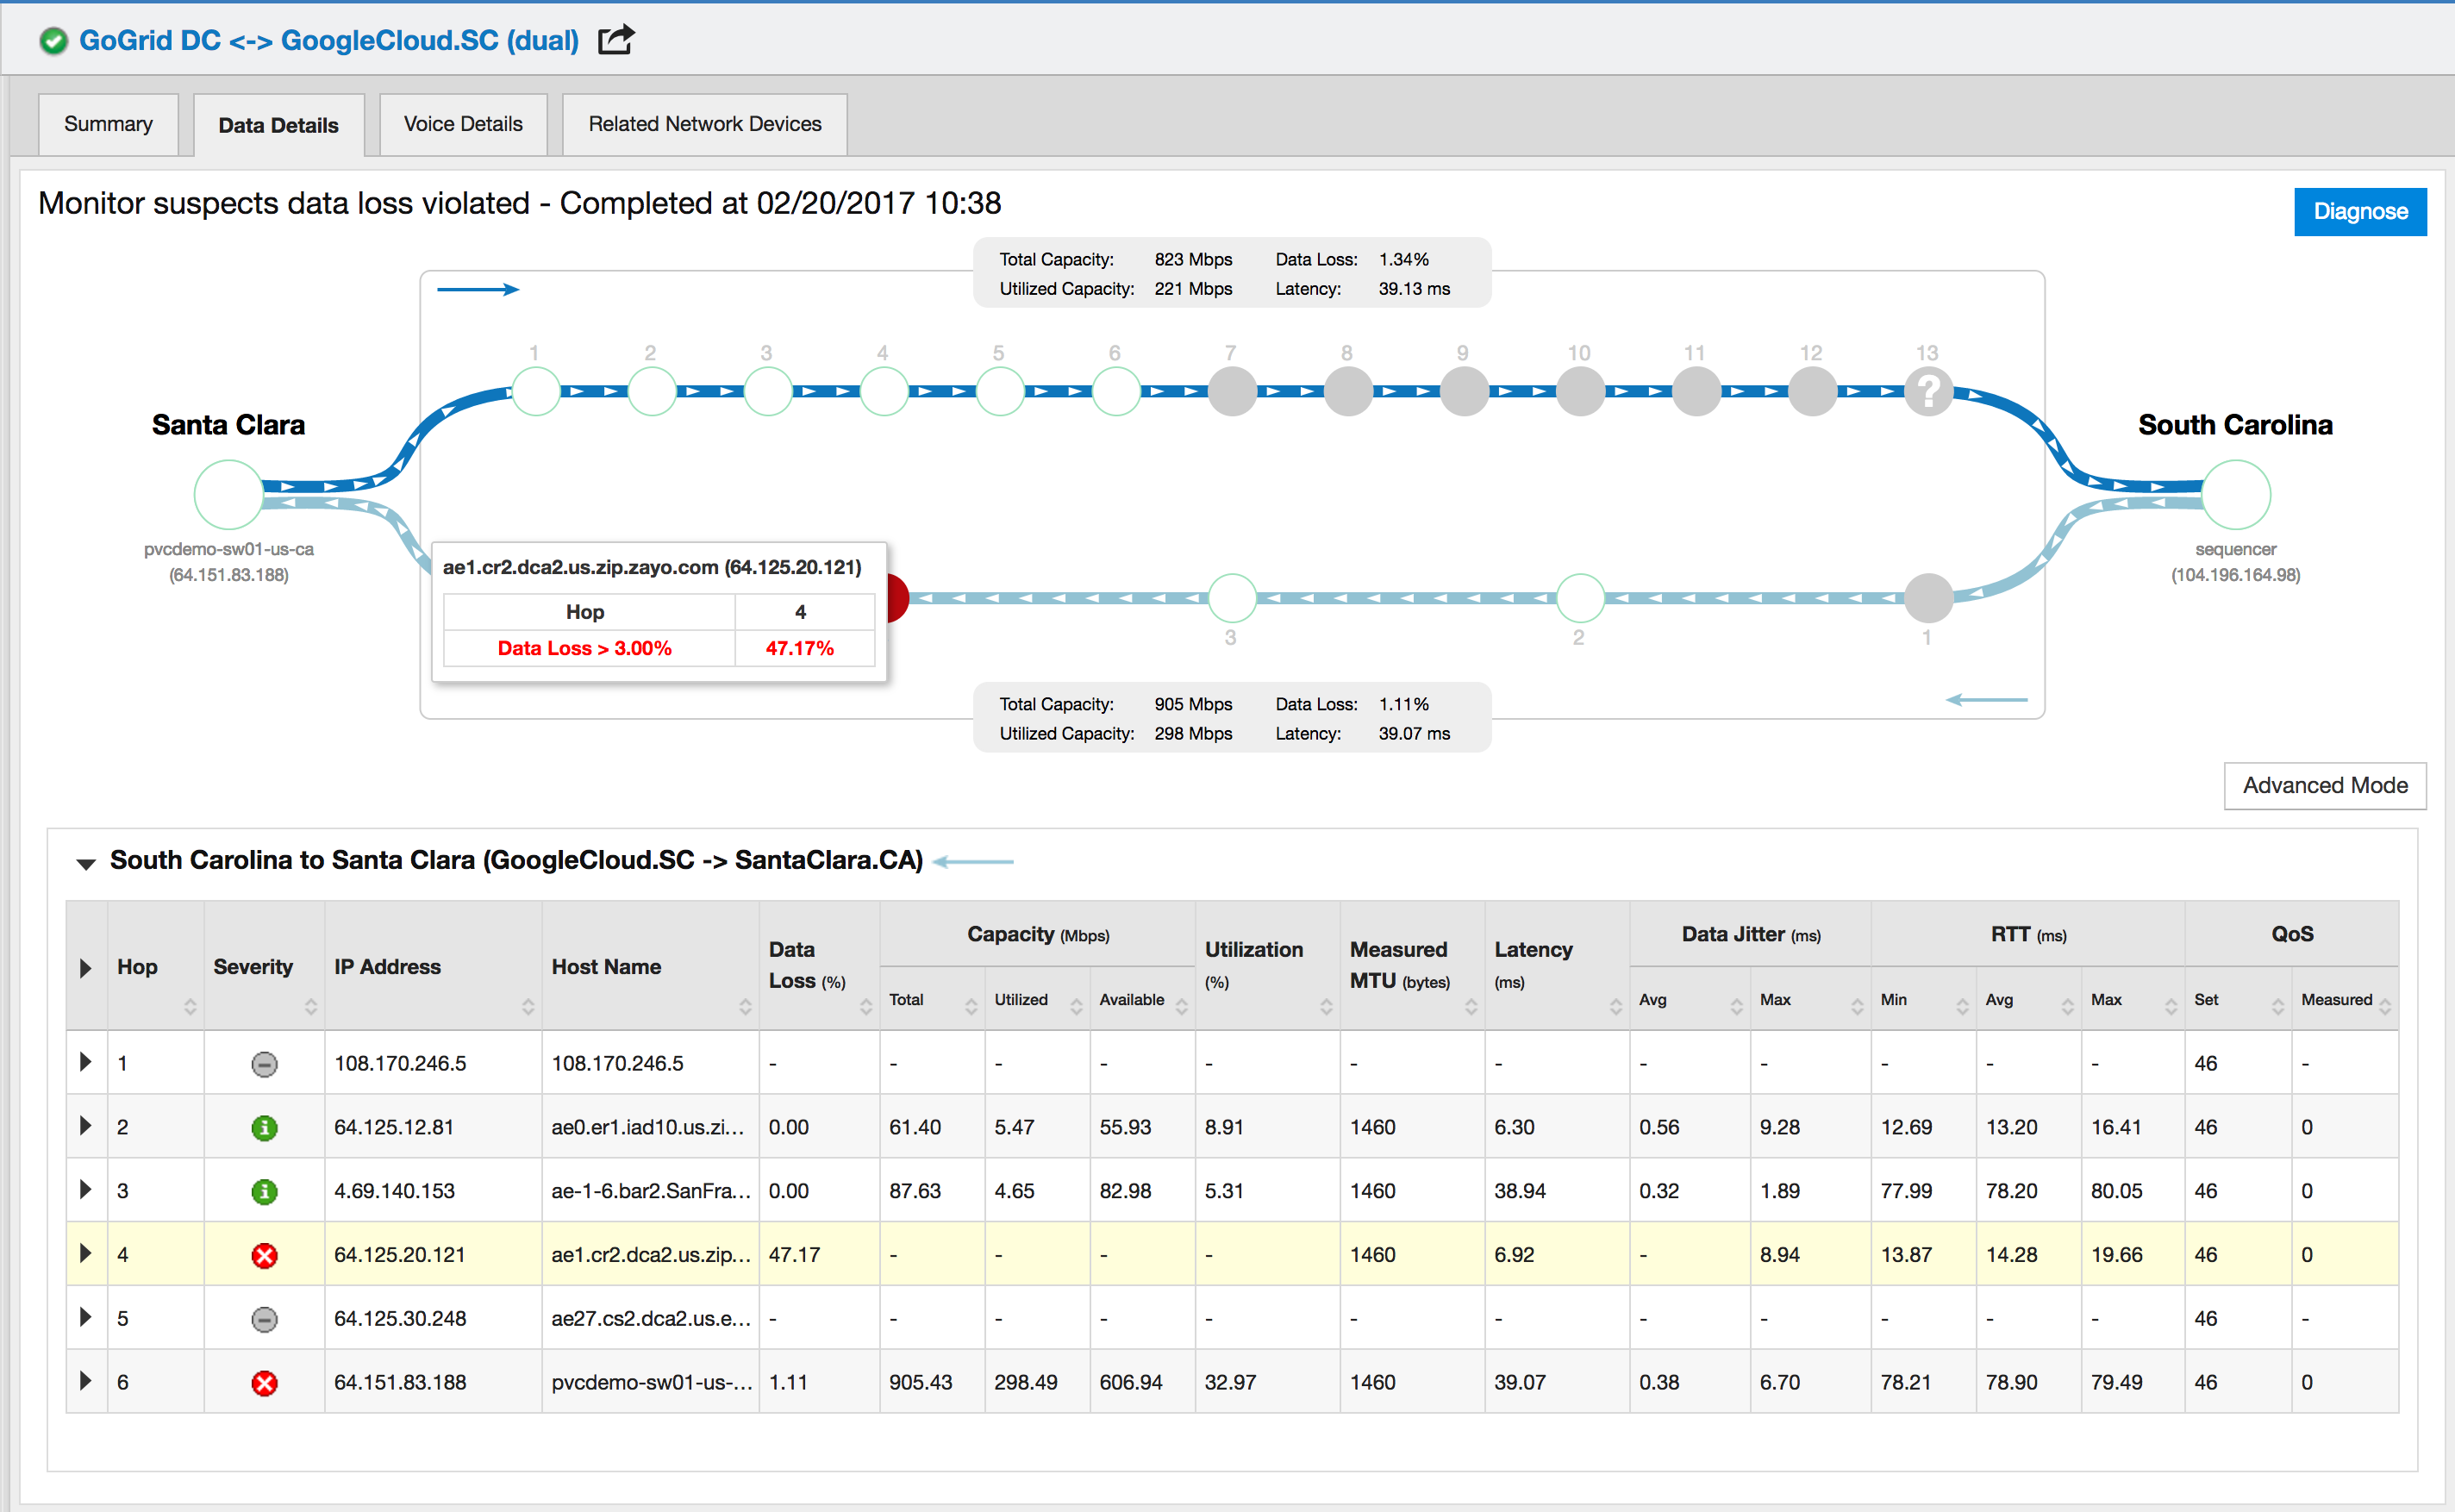
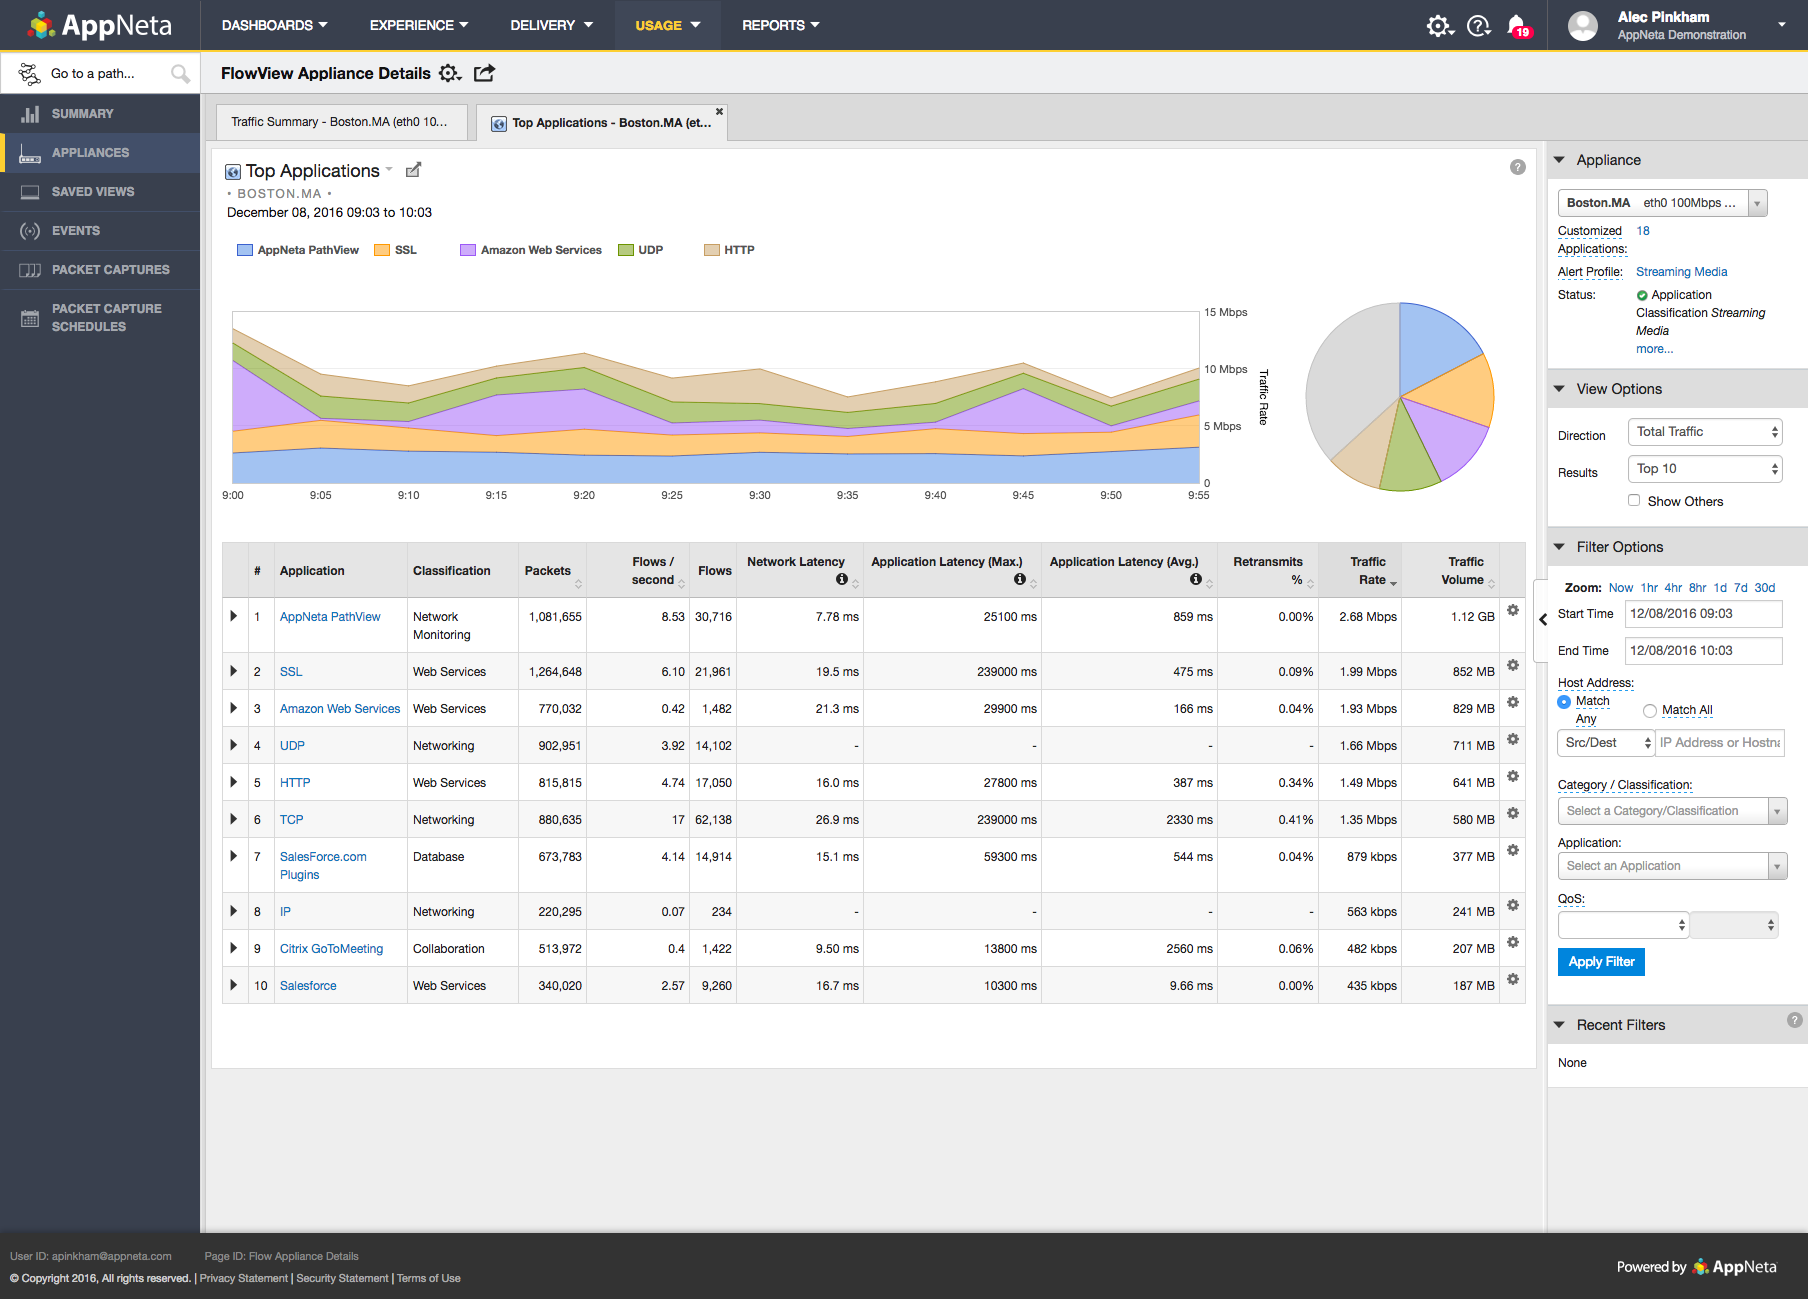
Splunk Infrastructure Monitoring Screenshots

Screenshot of Real-time monitoring for public, private and hybrid cloud