Chartio (discontinued) vs. Grist
Chartio (discontinued) vs. Grist
| Product | Rating | Most Used By | Product Summary | Starting Price |
|---|---|---|---|---|
 Chartio (discontinued) | N/A | Chartio is a visualization tool designed to enable anyone to explore, transform and visualize data on the fly through a drag-and-drop interface. Chartio was acquired by Atlassian in February 2021 so that it's capabilities could be integrated into the Atlassian product portfolio's capabilities. Chartio is no longer available to new customers, standalone. Existing customers must migrate to alternatives by March 2022, when the service will be retired. | $40 per user/per month | |
 Grist | N/A | Grist combines the capabilities of spreadsheets, databases and app builders. Using a familiar spreadsheet interface, information can be organized as a relational database, and dashboards built using drag-and-drop. Solving spreadsheet problems Ensures data is well-structured and stored in one place with no duplication, no spreadsheet-wrangling, no merging documents. Collaboration on sensitive data Data is protected… | $8 per month per user |
| Chartio (discontinued) | Grist | |||||||||||||||
|---|---|---|---|---|---|---|---|---|---|---|---|---|---|---|---|---|
| Editions & Modules |
|
| ||||||||||||||
| Offerings |
| |||||||||||||||
| Entry-level Setup Fee | No setup fee | No setup fee | ||||||||||||||
| Additional Details | — | — | ||||||||||||||
| More Pricing Information | ||||||||||||||||
| Chartio (discontinued) | Grist | |
|---|---|---|
| Top Pros | ||
| Top Cons |
|
|
| Chartio (discontinued) | Grist | |||||||||||||||
|---|---|---|---|---|---|---|---|---|---|---|---|---|---|---|---|---|
| BI Standard Reporting |
| |||||||||||||||
| Ad-hoc Reporting |
| |||||||||||||||
| Report Output and Scheduling |
| |||||||||||||||
| Data Discovery and Visualization |
|
| Chartio (discontinued) | Grist | |
|---|---|---|
| Small Businesses |  IBM SPSS Modeler Score 7.8 out of 10 |  Microsoft Excel Score 8.9 out of 10 |
| Medium-sized Companies |  Mathematica Score 8.2 out of 10 | Microsoft Excel Score 8.9 out of 10 |
| Enterprises | IBM SPSS Modeler Score 7.8 out of 10 | Microsoft Excel Score 8.9 out of 10 |
| All Alternatives | View all alternatives | View all alternatives |
| Chartio (discontinued) | Grist | |
|---|---|---|
| Likelihood to Recommend | 8.0 (30 ratings) | 9.9 (2 ratings) |
| Likelihood to Renew | 8.0 (24 ratings) | - (0 ratings) |
| Usability | 7.6 (6 ratings) | - (0 ratings) |
| Availability | 8.6 (2 ratings) | - (0 ratings) |
| Performance | 7.3 (1 ratings) | - (0 ratings) |
| Online Training | 8.2 (1 ratings) | - (0 ratings) |
| Implementation Rating | 7.3 (1 ratings) | - (0 ratings) |
| Product Scalability | 6.8 (2 ratings) | - (0 ratings) |
| Chartio (discontinued) | Grist | |
|---|---|---|
| Likelihood to Recommend |  Atlassian
 Kyle Epps Sr. Manager, Business Operations and Technology | Grist Labs
|
| Pros | Atlassian
| Grist Labs
|
| Cons | Atlassian
| Grist Labs
|
| Likelihood to Renew | Atlassian
 Devin Knight User Researcher | Grist Labs No answers on this topic |
| Usability | Atlassian
| Grist Labs No answers on this topic |
| Online Training | Atlassian
| Grist Labs No answers on this topic |
| Alternatives Considered | Atlassian
| Grist Labs
|
| Scalability | Atlassian
 Asa Pogrelis Director of Sales and Marketing | Grist Labs No answers on this topic |
| Return on Investment | Atlassian No answers on this topic | Grist Labs
|
| ScreenShots | Chartio (discontinued) Screenshots      | Grist Screenshots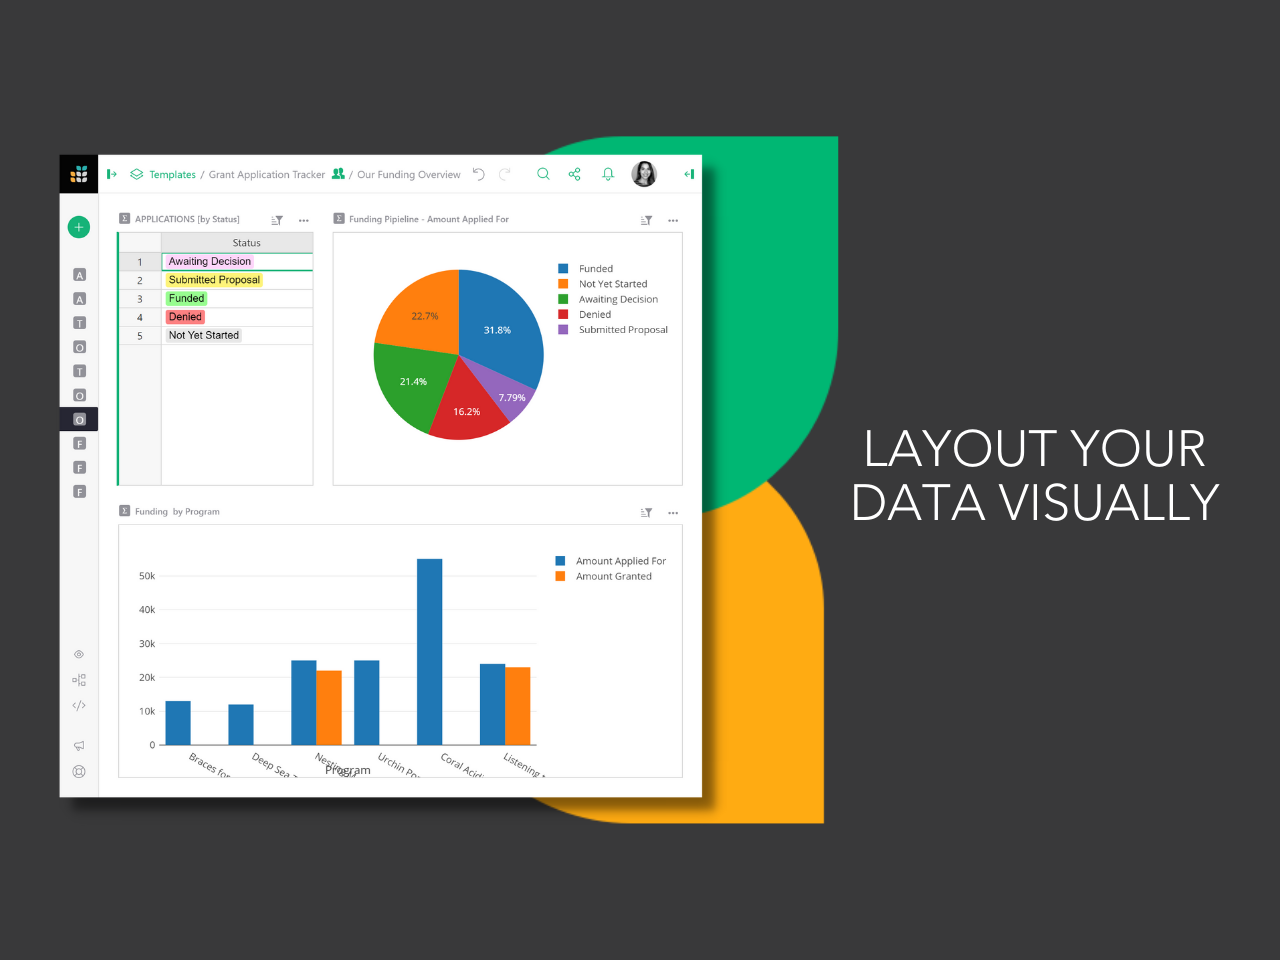  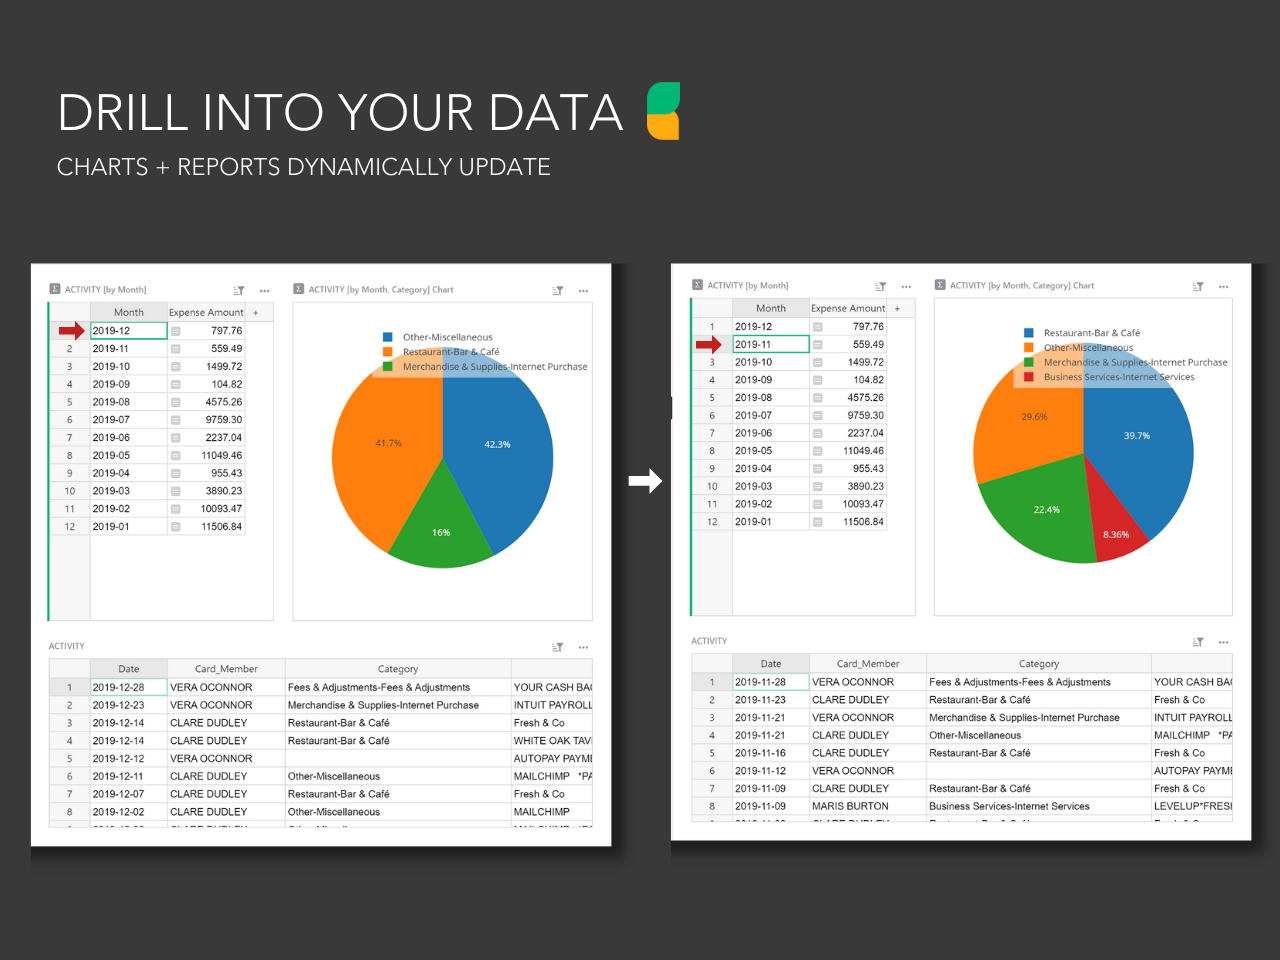  |