Chartbeat delivers real-time analytics, insights, and transformative tools for content teams around the world, to help improve audience engagement, inform editorial decisions, and increase loyalty.
N/A
Coremetrics / IBM Digital Analytics (discontinued)
Score 9.0 out of 10
N/A
Based on the former Coremetrics, IBM Digital Analytics is a discontinued analytics product. IBM acquired Coremetrics in 2010, and re-branded the platform to the IBM Digital Marketing Optimization Solution. Product support was ultimately provided by Acoustic, but the product is not a part of the company's plans going forward.
N/A
Pricing
Chartbeat
Coremetrics / IBM Digital Analytics (discontinued)
Editions & Modules
No answers on this topic
No answers on this topic
Offerings
Pricing Offerings
Chartbeat
Coremetrics / IBM Digital Analytics (discontinued)
Free Trial
Yes
No
Free/Freemium Version
No
No
Premium Consulting/Integration Services
No
No
Entry-level Setup Fee
No setup fee
No setup fee
Additional Details
Chartbeat pricing is based on monthly site page views. Discounts are applied to multi-year contracts. The Basic Plan includes the Real-time Dashboard, Historical Dashboard, Heads Up Display, Reports, Big Board, iOS and Android app, and Real-time API endpoints.
The Plus Plan includes all of the Basic Plan features, plus ONE of the following Premium features: Headline Testing, Advanced Queries, or Multi-Site View.
The Premium Plan includes all of the Basic Plan features, plus ALL Premium features: Headline Testing, Advanced Queries, Multi-Site View, and enterprise-level support and custom trainings.
Coremetrics / IBM Digital Analytics (discontinued)
Considered Both Products
Chartbeat
Verified User
Anonymous
Chose Chartbeat
We use Chartbeat in conjuction with these tools. Chartbeat is forward facing and we encourage everyone in the newsroom to use it. It provides the best live view, but lacks depth needed for more longer-term trend reporting and analysis. Domo allows much more advanced data …
Google Analytics 360 had problems, but after it was discontinued, Google Analytics became a shell of its former self. An added benefit of Chartbeat is that it's more "live" (looking at live concurrents rather than in the past however many minutes) and tells you how that number …
We use Chartbeat for real-time evaluation and Adobe Analytics for longer-term performance reporting. Chartbeat is easier to use overall, particularly for content producers. Researchers tend to rely on Adobe Analytics for their reports. We have found that we need to keep using …
Google Analytics has gradually become much more difficult to use, and much slower in its realtime reporting. It was the changes that came in with Google Analytics 4 that gave us the final push to work with Chartbeat - a product some of us were already familiar with from …
Omnilytics is more robust, detailed, and catered for an intermediate media user, while I think Chartbeat is a more user-friendly and beginner-oriented piece of technology. That being said, there is an impressive amount of lift for Chartbeat, and it's evident that simplicity is …
I used Parse.ly before I used Chartbeat. We shifted away from Parse.ly because it's social standing wasn't as good, it was mostly for site readership and we needed a bigger concentration on social media that Parse.ly couldn't provide. It's not listed, but we now use Social Flow …
Chartbeat stands out in terms of real-time tracking and information from which to manage homepages, I found this better than Smart Octo's equivalent. However, the ability to quickly explore past data does not go as deep as Google Analytics.
Chartbeat is better than GA when it comes to ease of use and immediacy. The homepage layover that Chartbeat offers is unique from what I've seen and gives me an instant knowledge of what's working on my site and how to best arrange it.
Other products like Chartbeat that I've used are Parse.ly, GA, and Omniture. Parse.ly is the only tool, in my opinion, that offers more real-time data, but the interface is lacking and isn't as intuitive as Chartbeat.
Chartbeat is certainly better at visualizing content and segmenting the data all on one screen. We can filter by section, author, channel and more without leaving the main dashboard page. Combining properties together in roll up groups is another key feature. We're able to …
Coremetrics / IBM Digital Analytics (discontinued)
Verified User
Anonymous
Chose Coremetrics / IBM Digital Analytics (discontinued)
In comparison to Adobe, I believe IBM Digital Analytics and Adobe Analytics are fairly similar in terms of features. When it comes to the marketing attribution approach, IBM is what sets it apart. Additionally, pre-integrated technologies with great ROI, like LIVEmail or IBM …
Chose Coremetrics / IBM Digital Analytics (discontinued)
Cognos has exploration but it doesn't have much AI and ML functionality. Watson is much more helpful when it comes to customer experience analytics. Watson gives clarity into end-to-end journeys and effectiveness while also giving the ability to visualize the actual customer …
Chose Coremetrics / IBM Digital Analytics (discontinued)
IBM Analytics is a great tool for measuring and analyzing web traffic along with consumer behavior to a degree. When compared to other solutions and tools available in the market today, I'd suggest checking out Kissmetrics or even Google analytics over this tool. Ultimately, it …
Chose Coremetrics / IBM Digital Analytics (discontinued)
IBM Digital Analytics was already in place when our team was brought on. None of us are fans. IBM does not seem to care from a customer service level whether or not we are satisfied or getting what we need out of their offering.
Chose Coremetrics / IBM Digital Analytics (discontinued)
I think that Google Analytics does everything just a little bit better than IBM. I was brought in with IBM being so deeply integrated with existing systems that changing to another tool isn't viable at this time.
Chose Coremetrics / IBM Digital Analytics (discontinued)
The alternative products mentioned differ wildly.
Adobe Analytics is similar to IBM CXA although not as strong for transactional web assets (eStores). In keeping with IBM CXA, integration with Adobe's own suite of products is strong. However, in a heterogeneous environment, this …
Chose Coremetrics / IBM Digital Analytics (discontinued)
IBM Analytics typically goes up against Adobe Analytics in the enterprise web analytics product selection process. When we determine a client isn't after the big guns, we'll usually refer them to Google Analytics, but when individual user conversion tracking is a must, we will …
Chose Coremetrics / IBM Digital Analytics (discontinued)
We have used Adobe Analytics and Google Analytics in similar instances. IBM Digital Analytics is between the 2 products, slightly better than Google Analytics but far behind the flexibility offered in Adobe.
Chose Coremetrics / IBM Digital Analytics (discontinued)
Google Analytics - Compared to IBM, not as strong on the product reporting (product views, abandoned carts etc.). The end results can be achieved through custom variables, but that does require custom coding. While Google does at least have a reporting API, it is not nearly as …
Chose Coremetrics / IBM Digital Analytics (discontinued)
Google Analytics is great low cost alternative to IBM Digital Analytics for smaller, low traffic sites but does not offer the in depth product performance reports we require for our retail clients. IBM can add notes on Google's user interface but Google should really add …
Verified User
Anonymous
Chose Coremetrics / IBM Digital Analytics (discontinued)
As a consulting company, we tailor the analytics solution to our clients. Usually they start with a free solution like Google Analytics, but they rapidly end up with a paying solution because it offers a deeper analysis and less restrictions on the data.
For instance Google …
Verified User
Anonymous
Chose Coremetrics / IBM Digital Analytics (discontinued)
Much of the work we did in IBM Digital Analytics could have been answered through Google Analytics, a much simpler, agile and FREE solution set. Not mention, given the vast number of Google Analytics USERS, free and actionable support is simply a click away ... this compared to …
Chose Coremetrics / IBM Digital Analytics (discontinued)
Have extensive use of Omniture and Google Analytics, but I find Digital Analytics the best for retailers. It's is an easy to use solution that highlights the merchandising and marketing issues related to your website.
Verified User
Anonymous
Chose Coremetrics / IBM Digital Analytics (discontinued)
Compared to Adobe: I think Adobe Analytics and IBM DA are very close in terms of functionalities. IBM makes the difference when it comes to the marketing attribution model. Also, the pre-integrated solutions such as LIVEmail or IBM Recommendations are very easy to use and allow …
Chose Coremetrics / IBM Digital Analytics (discontinued)
I mentioned Adobe and Google and made some comparisons in prior questions. I believe that any of these packages can be made quite powerful with a good implementation, which includes a good tagging strategy. I like Coremetrics best because I believe it is easier to get a solid …
Chose Coremetrics / IBM Digital Analytics (discontinued)
I feel that Google Analytics give you what you really need, without the hefty price tag. Along with giving you what you need, it is extremely more user friendly than IBM DA and can be easily learned by a multitude of people while still giving very significant information that …
Chose Coremetrics / IBM Digital Analytics (discontinued)
At the time we signed they were a Cadillac of software, there are really only 1-2 others that can compete on their level but that comes at a cost.
Verified User
Anonymous
Chose Coremetrics / IBM Digital Analytics (discontinued)
IBM analytics prices can get really high if you overpass the contracted server calls, also increasing the amount of credits reports can get you the price to the roof
Chose Coremetrics / IBM Digital Analytics (discontinued)
Webtrends and Omniture were on the shortlist. Webtrends tagging implementation seemed a little less flexible than Omniture and Coremetrics. When it finally came down to pricing and desired features, Omniture and Coremetrics were not significantly different, so we based the …
Verified User
Anonymous
Chose Coremetrics / IBM Digital Analytics (discontinued)
Omniture and Webtrends were also considered. When business needs are met by both Coremetrics and Omniture, the latter tends to be more expensive. Webtrends is often a good choice when server logs are also used with page tags. Server logs is an older technology which tends to …
Features
Chartbeat
Coremetrics / IBM Digital Analytics (discontinued)
Web Analytics
Comparison of Web Analytics features of Product A and Product B
Chartbeat
7.8
Ratings
4% below category average
Coremetrics / IBM Digital Analytics (discontinued)
-
Ratings
Lead Conversion Tracking
6.10 Ratings
00 Ratings
Bounce Rate Measurement
6.90 Ratings
00 Ratings
Device and Browser Reporting
7.70 Ratings
00 Ratings
Pageview Tracking
8.80 Ratings
00 Ratings
Event Tracking
8.30 Ratings
00 Ratings
Reporting in real-time
9.40 Ratings
00 Ratings
Referral Source Tracking
8.40 Ratings
00 Ratings
Customizable Dashboards
6.70 Ratings
00 Ratings
Best Alternatives
Chartbeat
Coremetrics / IBM Digital Analytics (discontinued)
Coremetrics / IBM Digital Analytics (discontinued)
Likelihood to Recommend
It is well suited to keeping me toward a specified goal, and gives me concrete numbers and gives me an idea of what we need to do to meet our goals. It's less appropriate if you want something more than pageviews, and doesn't really do a lot for video views.
As mentioned earlier, transactional heavy web assets such as eStores are particularly strong candidates.
IBM CXA along with other, similar tools, is not set-and-forget. The solution must be well managed in order to deliver value. Purchase of the solution is one thing; driving analytic results is another. If a company's staff are not strong analytical thinkers, CXA will not help. IBM CXA is not just a technology platform - it is a basis to design strong customer touchpoints and interactions. You need to be customer journey design literate to get the best from this.
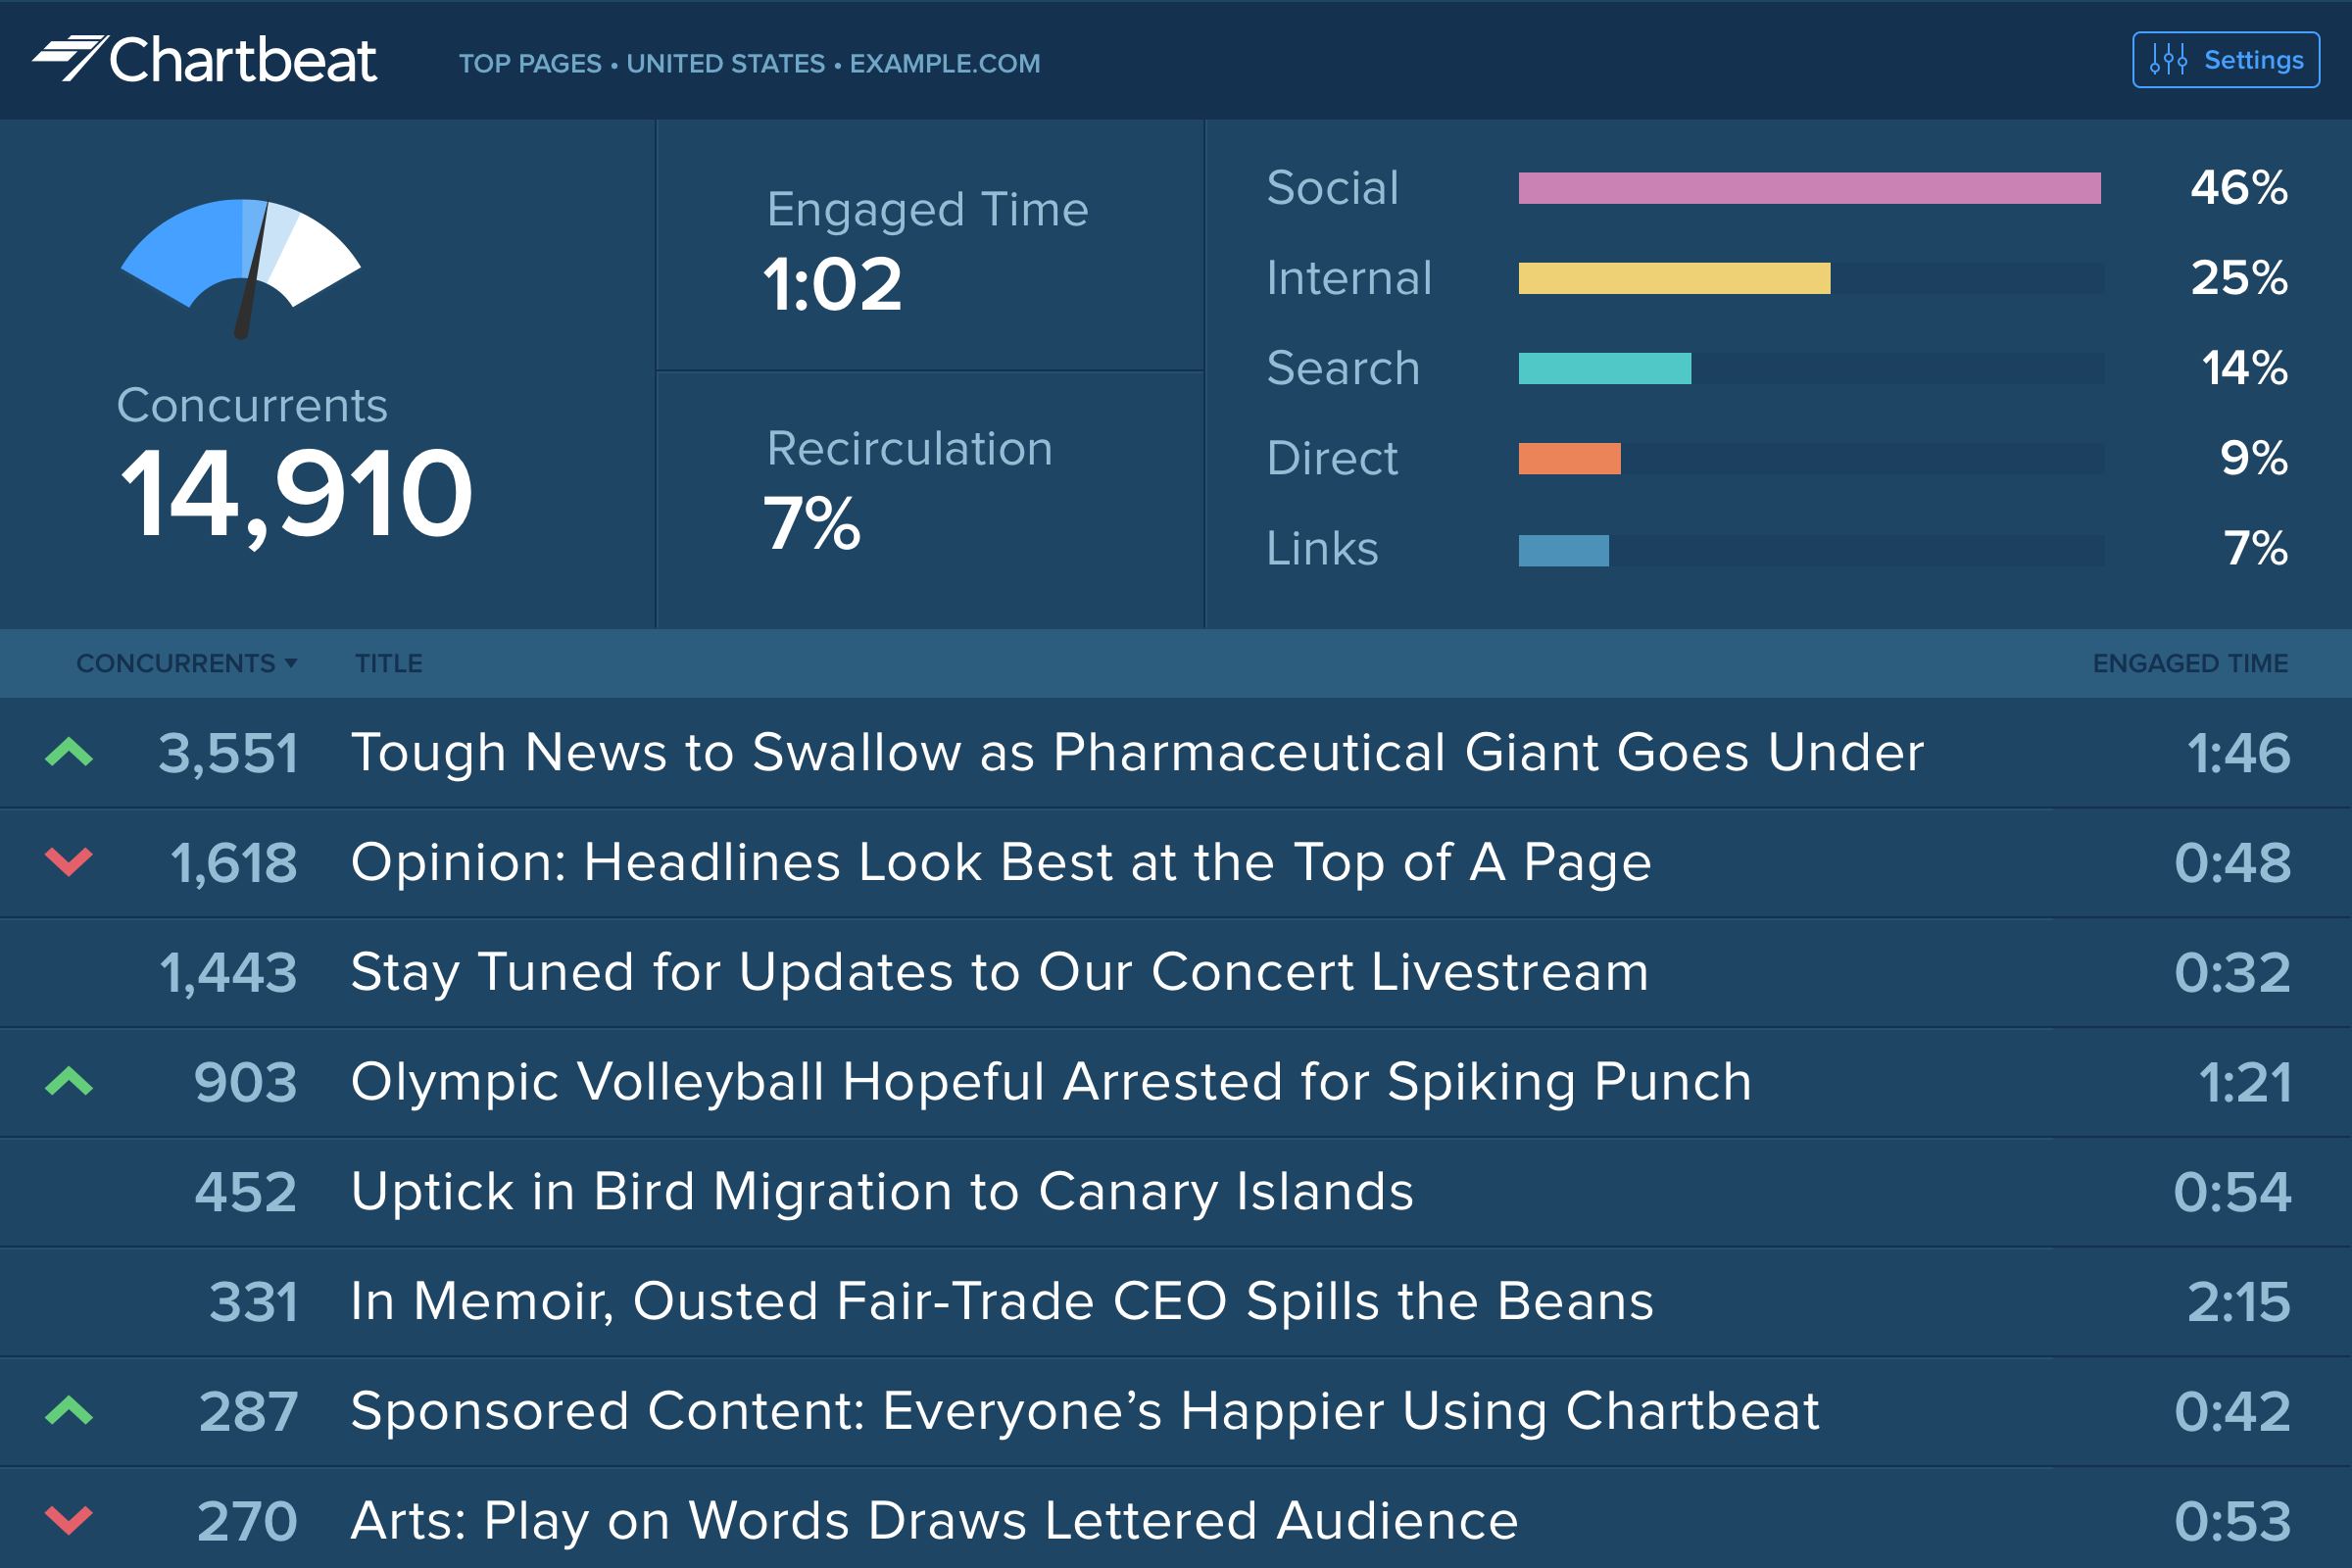
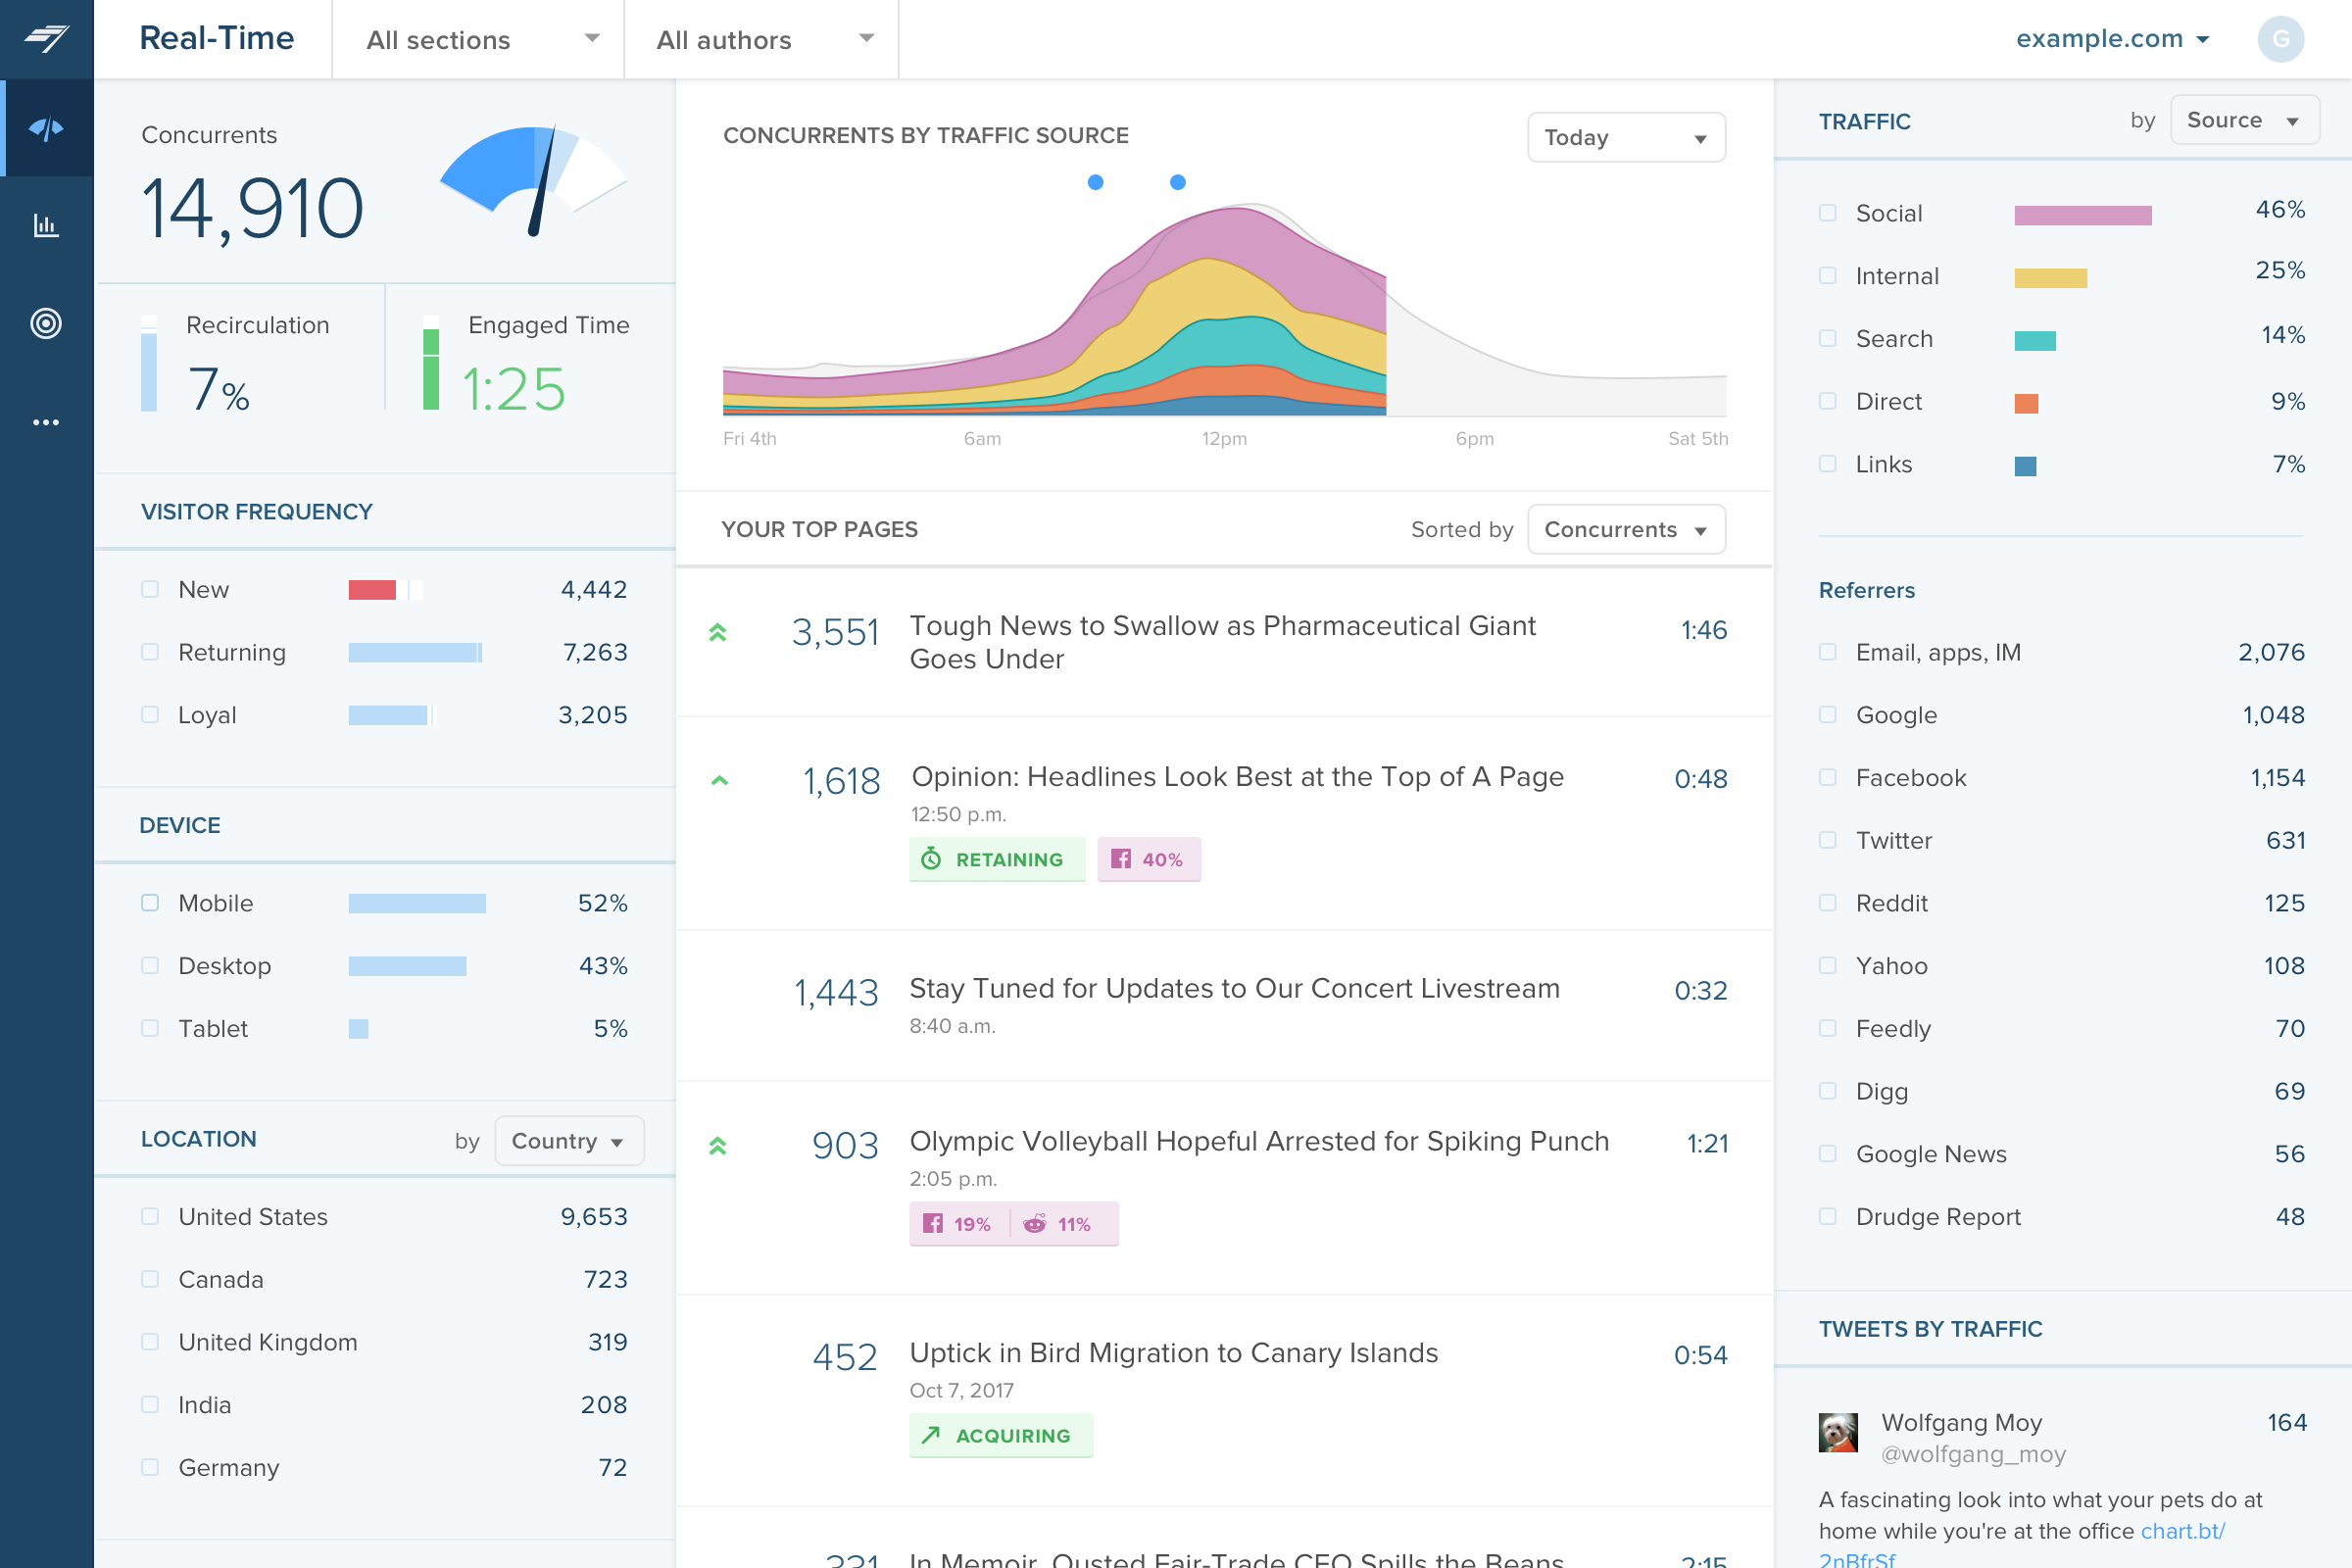
Source of traffic needs improvement. Search and social make sense, but "internal" and "links" is a grey area. It would be helpful to define those with an organization and provide an information icon so users can easily remember what each of those buckets is tracking.
More ways to customize the real-time board. For example, with video content, that's great that I can see a user has started a video, but what is the completion rate, was that only on O&O or can that track Facebook, too?
Would like to see demo (age) information included as a way to slice the data so I can see what's working with my older and younger demo.
The new UI is slow, buggy, incomplete, is not intuitive, and has limited support or explanation.
The demo videos for the new UI showcase features that are not even available in the new UI and support said those features may never be available so they are not sure either why they are shown in the demo videos.
Tag management is extremely manual leaving a lot of room for human error.
Support across the board for the legacy UI and new UI are not very helpful. They typically do not take the time to understand the root of your problem and commonly default to the response "that feature is not available". For example, you cannot currently delete reports in the new UI even though there is a delete button available. Support says the feature is not available, so if you want anything deleted you have to submit a list to support and they will delete it for you. This is extremely frustrating when you are creating "test" reports in the new UI and then you have no option to delete them when done.
I gave Chartbeat a 5 for a renewal rating, because, while it delivers clear and understandable content, Google Analytics also provides many of the same features for free. For a small to medium website, I believe it would be more cost effective to use Google Analytics. A website with a high amount of traffic, however, could merit spending the money on Chartbeat to maximize their potential.
It is still a best in class analytics platform, but working with IBM contracting has proven to be quite a hassle at times... There are proven pros and cons to each of the major systems and vendors (most I already listed). I always recommend to establish the business questions you are trying to answer, determine which platform answers them best and decide whether it is worth the dollar investment
Chartbeat is really pretty straightforward. The only things that may cause confusion are the string of sidebar features and tools at the left of the screen. I mostly use the big leader board in real-time and the historical feature (looking at the monthly or weekly performance of my team's content) and then generate reports automatically from there.
As reports are templated, the system is pretty quick. Sometimes you have to wait a bit for a report to render. Or you might have to re-load the page. But there is no real issue here and the system is on par with other similar systems.
I have had limited experience of support for Chartbeat but whenever I have needed help it has been there. Recently there was an issue of seeing different forms of data in real time - app and otherwise effectively, and the issue was being clearly dealt with and communicated back to us.
Overall, the level of support is very good and I would say it is a strong asset of the solution. However, you can sometimes feel that there is a difference of level among the support team.
Online training is really great. One of the best assets that they have. Lots of great videos, pop quizzes at the end of each module. Fantastic. Other tools have similar features, but not as good.
Google Analytics has gradually become much more difficult to use, and much slower in its realtime reporting. It was the changes that came in with Google Analytics 4 that gave us the final push to work with Chartbeat - a product some of us were already familiar with from previous jobs. Things are just much harder to find in GA, and when time is always tight you can't afford to spend a long time looking for particular data - it should be quick and easy to locate
IBM Analytics is a great tool for measuring and analyzing web traffic along with consumer behavior to a degree. When compared to other solutions and tools available in the market today, I'd suggest checking out Kissmetrics or even Google Analytics over this tool. Ultimately, it will come down to the end user and if they are comfortable in the environment of the backend and workflows of IBM Digital Analytics.
This solution can support large amount of data and transaction. The way that user management features are built, it shows it is meant for large organizations.
Using IBM Digital Analytics has allowed us to optimize marketing spend for our clients and provide us the insight to reduce the spend on vendors that are not performing well or not bringing in qualified traffic.
Using IBM Digital Analytics data to power on-site product recommendations has increased the percentage of total sales from recommendation zones to around 10% compared to around 1% with manually merchandised zones.
Using IBM's TruePath Funnels to analyze the checkout process for various clients has allowed us to see where visitors are dropping out of the checkout process and make improvements to increase conversion rate.