Chose Datadog
Its the Enterprise level decision, definitely usability and features perspective Datadog is much more advanced.
| Product | Rating | Most Used By | Product Summary | Starting Price |
|---|---|---|---|---|
 Datadog | N/A | Datadog is a monitoring service for IT, Dev and Ops teams who write and run applications at scale, and want to turn the massive amounts of data produced by their apps, tools and services into actionable insight. | $1.27 per month (billed annually) per host | |
 Quantum Metric | Enterprise companies (1,001+ employees) | Quantum Metric is designed to help organizations build better digital products faster. Their platform for Continuous Product Design gives business and IT teams a single version of truth which the vendor describes as fast, quantified, and grounded on what customers actually experience. The solution ultimately aims to help teams agree on priorities, build products customers love, and innovate with speed and confidence. | N/A |
| Datadog | Quantum Metric | |||||||||||||||
|---|---|---|---|---|---|---|---|---|---|---|---|---|---|---|---|---|
| Editions & Modules |
| No answers on this topic | ||||||||||||||
| Offerings |
| |||||||||||||||
| Entry-level Setup Fee | Optional | No setup fee | ||||||||||||||
| Additional Details | Discount available for annual pricing. Multi-Year/Volume discounts available (500+ hosts/mo). | — | ||||||||||||||
| More Pricing Information | ||||||||||||||||
| Datadog | Quantum Metric | |
|---|---|---|
| Considered Both Products |  Datadog  Jeffrey van Santen Sr SWE Chose Datadog Datadog is a more complex but complete solution than any of the other Log Aggregation, monitoring, or general observabilty tools that we have trialed. I found it easier to setup following useful and up-to-date documentation provided directly by Datadog instead of scattered …  Vinit Parakh Sr. DevOps Engineer Chose Datadog First think first - it's easy to use, and very easy to implement in any infrastructure. It provides a custom dashboard and monitors. I’ve used or evaluated Grafana, Prometheus, Amazon CloudWatch, and Dynatrace, and each tool has strong capabilities. Prometheus + Grafana provide …  Joe Cardali Head of Engineering Chose Datadog Much more modern and advanced  Fernando Battistella DevOps Engineer Chose Datadog ease of use and implementation, other than new relic (which I think is terrible in every possible way), the other two support opentelemetry better, have more manageable costs and comparable basic services, but they do not have the breadt of services dd does. |  Quantum Metric  Khairul Islam Tonmoy Software Developer Chose Quantum Metric Quantum Metric has unmatched support and is easy to use. The simple data visualization gave us an excellent analysis on specific pages and was a game changer. In other words, other tools may offer the same, but that's all. An easy-to-understand breakdown of how customers spent …  niman goli Storage Lead Chose Quantum Metric its well suited for the environments for the workloads of huge transactions,huge I/O,avoiding delays for the workloads which need immediate attention with great workflows.For the great transformations and data mining it would be helpful,for great customer behaviorial, it would …  Henrique Tedeschi Senior Software Engineer Chose Quantum Metric Other tools might provide the tool in a very similar way, but that's it. Quantum Metric actually helps remove the abstraction from the data, their support is available in a very fast manner, they help us set goals and reach them, also helping us track them through the tool. …  Enrique Membreno Digital Analyst Chose Quantum Metric I have used other tools like Dynatrace. Quantum Metric is better suited to look for errors and spot issues in user sessions, it has a more friendly UI.  Gytis Juzenas Analyst Chose Quantum Metric The biggest QM advantage is that you can see customer's actions on the live preview and almost immediately. So you can catch customers up, on the session, while the customer is still using your portal. There is a lot of information provided on the session, like API calls and …  Jason LeBoeuf VP eCommerce Chose Quantum Metric Quantum Metric was much more affordable and implementation was much easier.  Christian Calvo Manager, Digital Site Health Chose Quantum Metric I like it more because it is much more quick for searches and replays, also making dashboards is much more easy with QM.  Mark McGuire Product Analyst Chose Quantum Metric None  Gloria Lago Manager, Measurement Strategy and Data Architecture Chose Quantum Metric We were using Clicktale at the same time as Quantum for Order Form Optimization recommendations but found that the amount of time invested and the quality of the tool from Quantum just seemed like a better fit for our organization. |
| Datadog | Quantum Metric | ||||||||||||||||||
|---|---|---|---|---|---|---|---|---|---|---|---|---|---|---|---|---|---|---|---|
| Mobile Capabilities |
| ||||||||||||||||||
| Results and Analysis |
|
| Datadog | Quantum Metric | |
|---|---|---|
| Small Businesses |  Amazon CloudWatch Score 7.8 out of 10 |  Smartlook Score 8.8 out of 10 |
| Medium-sized Companies |  ManageEngine Site24x7 Score 10.0 out of 10 |  Contentsquare Score 7.4 out of 10 |
| Enterprises | ManageEngine Site24x7 Score 10.0 out of 10 | Contentsquare Score 7.4 out of 10 |
| All Alternatives | View all alternatives | View all alternatives |
| Datadog | Quantum Metric | |
|---|---|---|
| Likelihood to Recommend | 8.9 (0 ratings) | 9.2 (0 ratings) |
| Likelihood to Renew | 1.0 (0 ratings) | 7.5 (0 ratings) |
| Usability | 8.7 (0 ratings) | 7.7 (0 ratings) |
| Support Rating | 5.0 (0 ratings) | 8.7 (0 ratings) |
| Implementation Rating | 1.0 (0 ratings) | 9.1 (0 ratings) |
| Datadog | Quantum Metric | |
|---|---|---|
| Likelihood to Recommend |
|
 Jess Johnson Director, Business Development |
| Pros |
 Aman Makwana DevOps Engineer |
 Erica D'Aloia Product Manager, Lifestages |
| Cons |
|
|
| Likelihood to Renew |
|
Enrique Membreno Digital Analyst |
| Usability |
|
 Salil Chatrath Senior Product Manager |
| Support Rating |
|
 Ben Anderson Product Management Intern - Ecommerce Team |
| Implementation Rating |
| No answers on this topic |
| Alternatives Considered |
Jeffrey van Santen Sr SWE |
Khairul Islam Tonmoy Software Developer |
| Return on Investment |
|
|
| ScreenShots | Datadog Screenshots      | Quantum Metric Screenshots   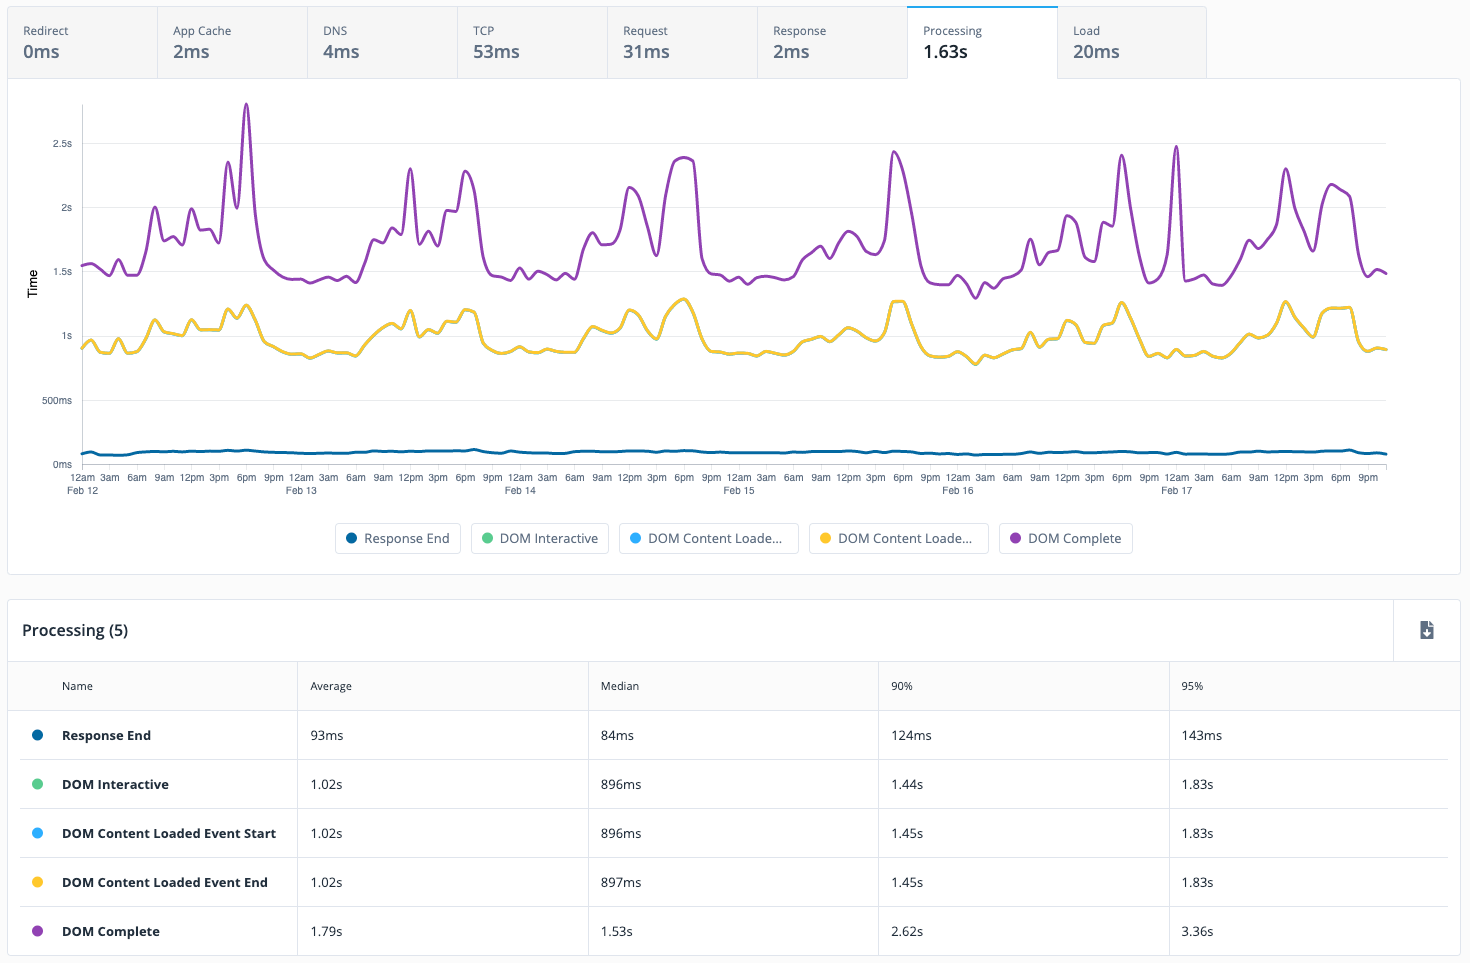 |