iDashboards Enterprise Suite vs. Cyfe, by Traject

Overview
ProductRatingMost Used ByProduct SummaryStarting Price
iDashboards Enterprise Suite
Score 3.0 out of 10
N/A
This web-based dashboard software displays data in real-time from databases, data warehouses, spreadsheets, XML and other data sources in a single location. iDashboards' built-in security framework provides role-based user permissions and access control. iDashboards Enterprise Suite is complete with software to custom build dashboards, perform what-if analytics, enable alerts and generate reports based on the displayed data in a dashboard.
$0
Per Seat per Month
Cyfe
Score 8.8 out of 10
N/A
Cyfe is all-in-one dashboard software for analyzing data from online services like Google Analytics, Salesforce, AdSense, MailChimp, Amazon, Facebook, etc, from Traject.
$29
Monthly or Annually
Pricing
iDashboards Enterprise SuiteCyfe, by Traject
Editions & Modules
Enterprise Suite
Per Seat per Month
Solo
$29
Monthly or Annually
Pro
$49
Monthly or Annually
Premier
$89+
Monthly or Annually
Agency
$150
Monthly or Annually
Offerings
Pricing Offerings
iDashboards Enterprise SuiteCyfe
Free Trial
YesYes
Free/Freemium Version
YesNo
Premium Consulting/Integration Services
YesNo
Entry-level Setup FeeRequiredNo setup fee
Additional Details——
More Pricing Information
Community Pulse
iDashboards Enterprise SuiteCyfe, by Traject
Top Pros
Top Cons
Features
iDashboards Enterprise SuiteCyfe, by Traject
BI Standard Reporting
Comparison of BI Standard Reporting features of Product A and Product B
iDashboards Enterprise Suite
6.8
4 Ratings
18% below category average
Cyfe, by Traject
6.9
27 Ratings
17% below category average
Pixel Perfect reports5.34 Ratings6.817 Ratings
Customizable dashboards9.04 Ratings5.027 Ratings
Report Formatting Templates6.13 Ratings9.120 Ratings
Ad-hoc Reporting
Comparison of Ad-hoc Reporting features of Product A and Product B
iDashboards Enterprise Suite
7.2
4 Ratings
11% below category average
Cyfe, by Traject
8.5
25 Ratings
5% above category average
Drill-down analysis8.14 Ratings8.715 Ratings
Formatting capabilities6.24 Ratings8.120 Ratings
Integration with R or other statistical packages9.11 Ratings10.09 Ratings
Report sharing and collaboration5.34 Ratings7.025 Ratings
Report Output and Scheduling
Comparison of Report Output and Scheduling features of Product A and Product B
iDashboards Enterprise Suite
9.1
3 Ratings
9% above category average
Cyfe, by Traject
9.2
22 Ratings
10% above category average
Publish to Web9.12 Ratings10.014 Ratings
Publish to PDF9.13 Ratings10.020 Ratings
Report Versioning9.11 Ratings6.89 Ratings
Report Delivery Scheduling9.12 Ratings10.016 Ratings
Delivery to Remote Servers00 Ratings9.04 Ratings
Data Discovery and Visualization
Comparison of Data Discovery and Visualization features of Product A and Product B
iDashboards Enterprise Suite
6.8
4 Ratings
17% below category average
Cyfe, by Traject
8.9
18 Ratings
10% above category average
Pre-built visualization formats (heatmaps, scatter plots etc.)6.24 Ratings8.017 Ratings
Location Analytics / Geographic Visualization7.24 Ratings8.614 Ratings
Predictive Analytics6.92 Ratings10.08 Ratings
Access Control and Security
Comparison of Access Control and Security features of Product A and Product B
iDashboards Enterprise Suite
7.8
4 Ratings
9% below category average
Cyfe, by Traject
8.6
21 Ratings
1% above category average
Multi-User Support (named login)8.14 Ratings10.020 Ratings
Role-Based Security Model7.24 Ratings6.314 Ratings
Multiple Access Permission Levels (Create, Read, Delete)8.14 Ratings8.416 Ratings
Single Sign-On (SSO)8.01 Ratings9.76 Ratings
Mobile Capabilities
Comparison of Mobile Capabilities features of Product A and Product B
iDashboards Enterprise Suite
8.5
3 Ratings
7% above category average
Cyfe, by Traject
9.3
19 Ratings
16% above category average
Responsive Design for Web Access9.13 Ratings9.418 Ratings
Mobile Application9.11 Ratings10.05 Ratings
Dashboard / Report / Visualization Interactivity on Mobile6.83 Ratings7.713 Ratings
Application Program Interfaces (APIs) / Embedding
Comparison of Application Program Interfaces (APIs) / Embedding features of Product A and Product B
iDashboards Enterprise Suite
-
Ratings
Cyfe, by Traject
8.4
6 Ratings
6% above category average
REST API00 Ratings8.64 Ratings
Javascript API00 Ratings10.02 Ratings
iFrames00 Ratings10.04 Ratings
Java API00 Ratings10.02 Ratings
Themeable User Interface (UI)00 Ratings5.94 Ratings
Customizable Platform (Open Source)00 Ratings5.83 Ratings
Best Alternatives
iDashboards Enterprise SuiteCyfe, by Traject
Small Businesses
SAP Crystal
SAP Crystal
Score 8.9 out of 10
BrightGauge
BrightGauge
Score 8.9 out of 10
Medium-sized Companies
Reveal
Reveal
Score 9.9 out of 10
Reveal
Reveal
Score 9.9 out of 10
Enterprises
Jaspersoft Community Edition
Score 9.7 out of 10
Jaspersoft Community Edition
Score 9.7 out of 10
All AlternativesView all alternativesView all alternatives
User Ratings
iDashboards Enterprise SuiteCyfe, by Traject
Likelihood to Recommend
6.0
(10 ratings)
8.0
(29 ratings)
Likelihood to Renew
8.6
(6 ratings)
9.4
(9 ratings)
Usability
9.0
(2 ratings)
7.0
(3 ratings)
Support Rating
-
(0 ratings)
10.0
(2 ratings)
Implementation Rating
-
(0 ratings)
10.0
(1 ratings)
User Testimonials
iDashboards Enterprise SuiteCyfe, by Traject
Likelihood to Recommend
iDashboards
iDashboards is well suited for an office environment or organization with fewer personnel and resources. Its efficiency allows for less "man" hours. In terms of selection, the primary key question during process was cost, great tech support service, and efficiency. About where it may be less appropriate, it will be an office where information production, consumption, and dissemination is not a priority
Read full review
Traject
Cyfe might be for you if you are looking for a cost-effective way to display all of your marketing metrics in one place. If you are looking for a detailed, fine-tuned, niche, or extremely specific metrics, this might not be the best solution. Cyfe is good for a general health check-up of marketing, but not a finely tuned examination.
Read full review
Pros
iDashboards
  • Designing a dashboard is easy. In other words, it is fairly easy to make data look really nice!
  • Data Analytics. This makes it easy to do calculations on your data (averages, etc.)
  • Training and examples: Our introduction to iDashboards was thorough. There are plenty of tutorials as well, plus manuals.
Read full review
Traject
  • Has preset metric groups that pull similar stats together in one "bucket" saving you the time of setting up each stat-line one by one
  • Allows you to easily adjust the timeframe for what stats you want to see, so you can find YOY stats or just last month's stats rather quickly
  • Colored visualizations of stats make it easy to notice when campaigns are taking off
Read full review
Cons
iDashboards
  • Provide basic video training tutorials
  • Ability to upload/convert Excel data to non-Windows servers such as Linux or AIX
  • Increase the data row limitation
Read full review
Traject
  • I'd love to see additional functionality to customize colors. The light/dark option is very nice, but a little more flexibility in the colors would go a long way, especially if it was possible at the dashboard level rather than just the account level. Along the same lines, being able to customize the charts a little more, for example being able to show an x-axis on single data type graphs, could make them easier to read in some cases.
  • Being able to choose to report on converted clicks or conversions in AdWords would be helpful.
  • Needs the ability to show the date range on the shared URL dashboards. Would be even better if the date range was adjustable on that view, too.
Read full review
Likelihood to Renew
iDashboards
Our executive leadership relies on the dashboards provided through the iDashboards software. Thus, there is no doubt the contract will be renewed.
Read full review
Traject
It has become a part of our internal tools so unless a competitor comes out with similar functionality as a similar price point it is unlikely that we would not renew. One area that would cause us not to renew would be if a competing service came out with more third-party integrations that match our needs. Price at this point is no longer an issue as it would allow us to automate a somewhat manual process that we have now connecting Cyfe widgets to Google Sheets.
Read full review
Usability
iDashboards
iDashboards are fairly logical and easy to use once you get started. I have taught myself most of what I know on my own, by taking webinars, reading through all the knowledge base, and doing the tutorials. Expertise is needed to do some of the data manipulation, but most graphs are simple to make.
Read full review
Traject
I gave it a rating of 7 because it does a good job at what it does, but there are missing that are missing which I would have benefited from. For instance, if I was able to drill down more on the specific metrics I was able to see, that would have been helpful.
Read full review
Support Rating
iDashboards
No answers on this topic
Traject
Because I had a very minor question and I was able to speak directly to the founder through LinkedIn and through email. I know that as they grow this may not always be an option but the fact that he made himself available to answer my questions said a lot about his passion for the product.
Read full review
Implementation Rating
iDashboards
No answers on this topic
Traject
Cyfe is a 15 minutes implementation, then some time to get your data sources created. This is an easy one person job that will not result in down time or unnecessary wasted man hours.
Read full review
Alternatives Considered
iDashboards
iDashboards is easy to use right out of the box. The price point is very, very appealing and it offers everything the other products offer - ease of use and low cost.
Read full review
Traject
The Salesforce dashboard is comparably flexible and intuitive, but designed more to its internal CRM focus. SumAll shares the social media dashboard capabilities, but lacks all others. Its interesting feature is side-by-side graph analysis for cross-channel performance. Cyfe might borrow from SumAll's default weekly email summary of performance from the dashboard, but implementation could be too complex. Nuvi dashboard is exclusively for social media marketing, but lacks Cyfe's flexibility for third party integration and window customization settings.
Read full review
Return on Investment
iDashboards
  • iDashboards saved us from making a sizable investment in another HR dashboard
  • iDashboards has improved the patient flow metrics
  • Multiple FTEs have been repurposed as a result of automating the visualization and dissemination of data
Read full review
Traject
  • Cyfe allows us to provide real time data to our clients
  • Cyfe allows us to provide detailed analytics to our clients showing actual results
  • Cyfe reduced our need to provide monthly "reports" to our marketing clients
  • Cyfe allows us to have better situational awareness and know what is going on throughout our multiple organizations
Read full review
ScreenShots

iDashboards Enterprise Suite Screenshots
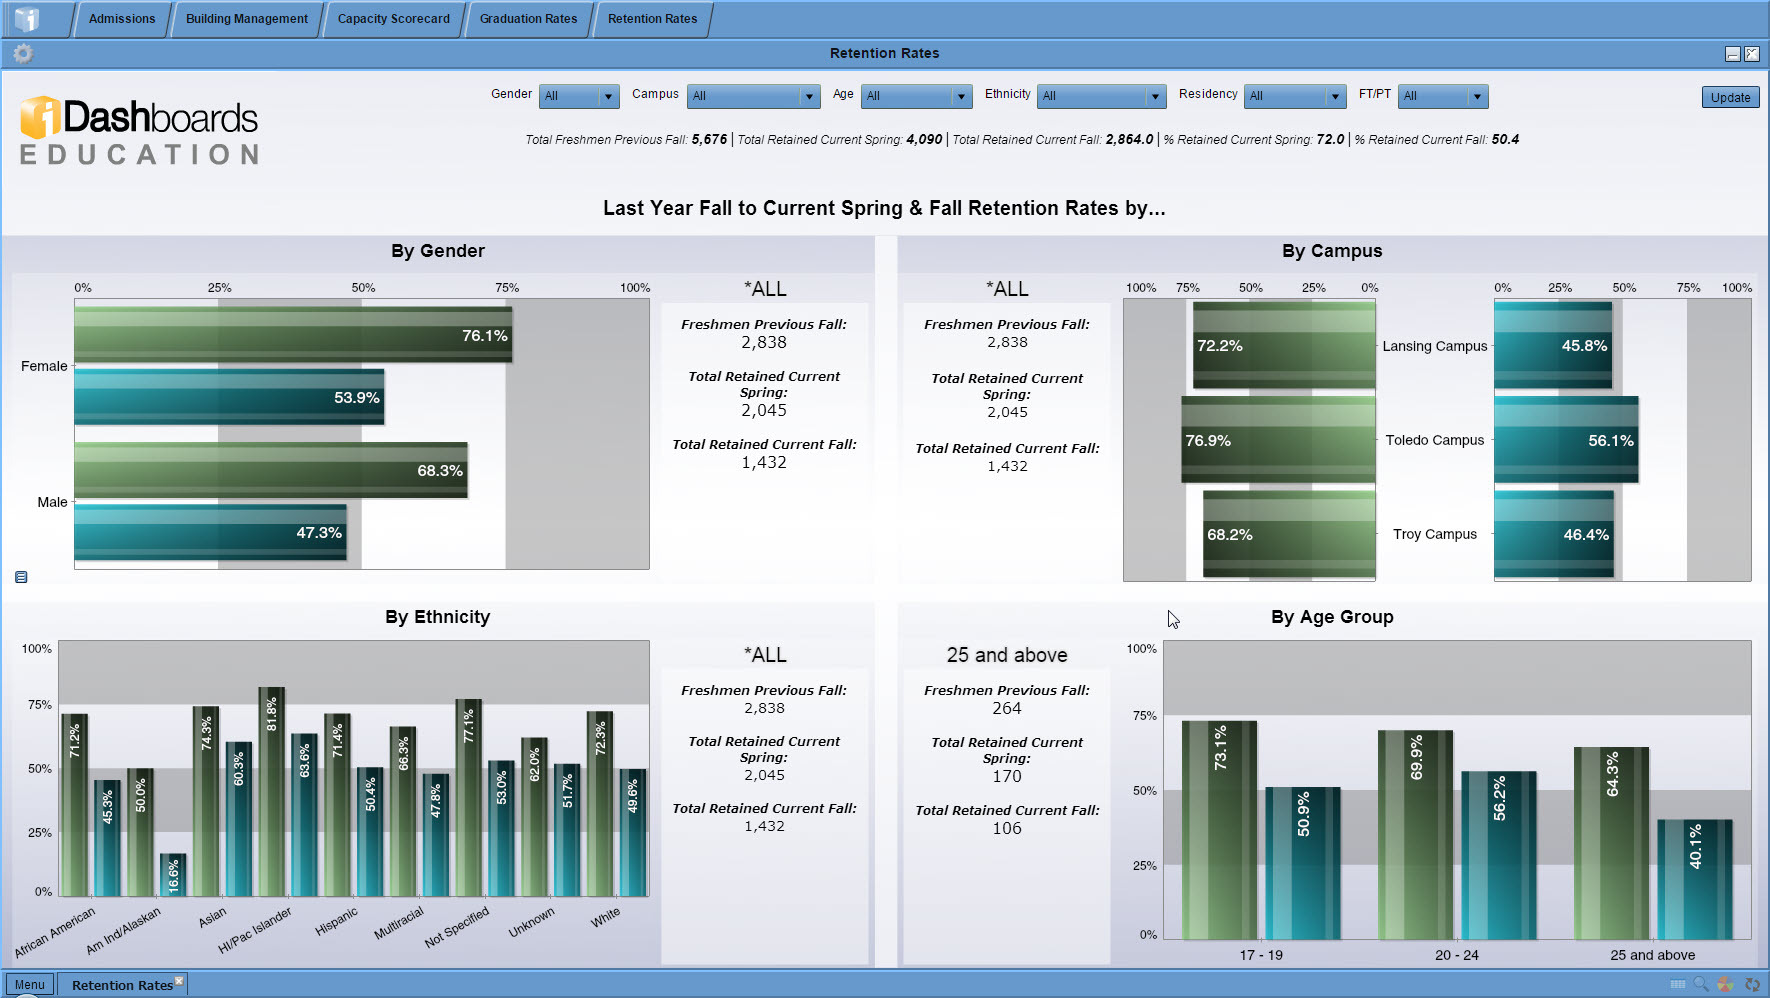
Screenshot of Government DashboardScreenshot of