NinjaOne (formerly NinjaRMM) is a security-oriented remote monitoring and management platform. It allows for manual customization as well as scripting and automation.
N/A
ScienceLogic SL1
Score 8.6 out of 10
Enterprise companies (1,001+ employees)
ScienceLogic is a system and application monitoring and performance management platform. ScienceLogic collects and aggregates data across and IT ecosystems and contextualizes it for actionable insights with the SL1 product offering.
$7.50
per month per node
Pricing
NinjaOne
ScienceLogic SL1
Editions & Modules
No answers on this topic
No answers on this topic
Offerings
Pricing Offerings
NinjaOne
ScienceLogic SL1
Free Trial
Yes
No
Free/Freemium Version
No
No
Premium Consulting/Integration Services
No
Yes
Entry-level Setup Fee
No setup fee
Required
Additional Details
NinjaOne is a subscription service with a charge rate per month. For more detailed pricing information, contact NinjaOne directly to request a demo or to start 14-days free trial.
ScienceLogic SL1 offers four tiers:
SL1 Advanced – Application Health, Automated Troubleshooting and Remediation Workflows
SL1 Base – Infrastructure Monitoring, Topology & Event Correlation
SL1 Premium – AI/ML-driven Analytics, Low-Code Automated Workflow Authoring
SL1 Standard – Infrastructure Monitoring – with Agents, Business Services, Incident Automation, CMDB Synchronization, Behavioral Correlation
To get pricing for each tier, please contact the vendor.
If you are looking for an affordable solution to RMM that just works, you should consider using NinjaOne. Their platform allows you to lock down the installation and prevent uninstallation by end users, it allows for direct ticket integration within the sys tray icon, and it is a very consistent product that will stay running when it is in use. That is not always the case with RMM solutions and for the price, NinjaOne is great.
Appropriate if you are setting up a monitoring suite in new Infrastructure Environment. Definitely NOT suited for Migration Projects. ScienceLogic SL1 cannot cater to a lot of monitoring requirements which already would have been configured in old monitoring suite. Plus, limited support for customizations and having to go to "Feature Requests" route makes in extremely complicated.
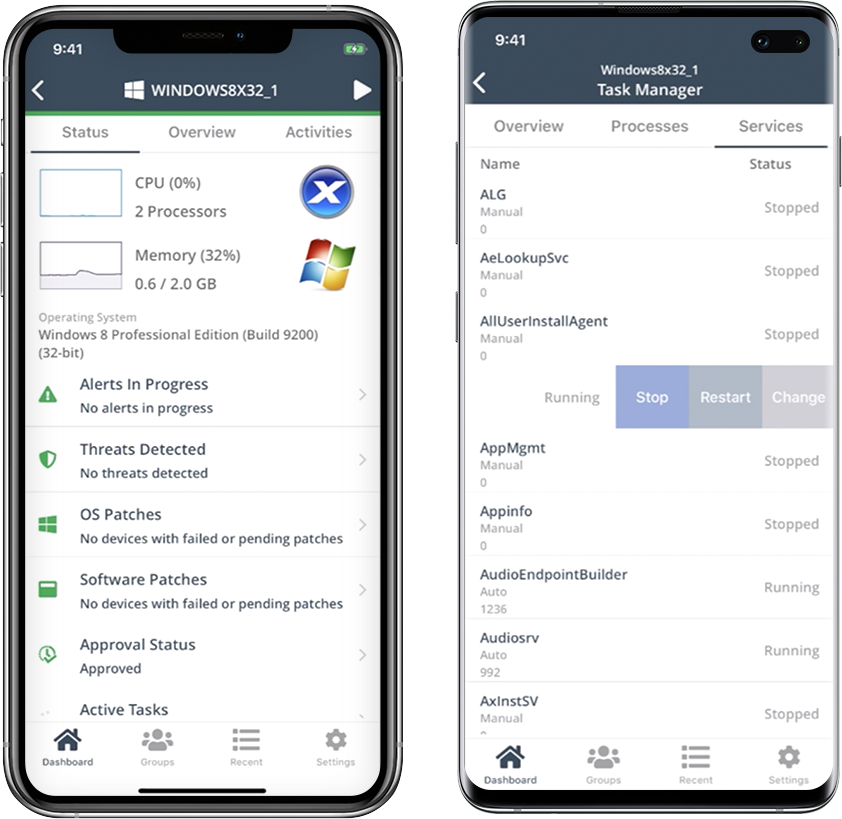
Remote connections: the NinjaRemote client is spectacular and very easy to use and navigate. It quickly connects to customer systems so my engineers are able to work. As a bonus, they also offer a really good mobile app to connect to client systems.
Antivirus: Bitdefender Endpoint Protection is built directly into the NinjaOne portal. This makes deploying and maintaining AV very easy.
OS Patching: NinjaOne makes it very easy to handle patching across multiple clients and locations. It is very easy to use and doesn't take long to set up.
Support: NinjaOne support is always very prompt and helpful.
Documentation: the NinjaOne Dojo is a one-stop shop for all of your FAQs, guides, and forum needs. You can find almost anything here to help you deploy and maintain NinjaOne.
Automation Library: NinjaOne comes preloaded with a large number of ready-to-go automations. They also provide you with a scripting module to create your own.
More freedom to create custom dashboards as on the previous versions we could do much more
The Performance TAB windows is too small and cannot be resized or maximized when looking at reports for "Overview", "File System" and any of those items.
There are not enough widgets to create stunning dashboard in AP2
I have not had any real issues with NinjaOne and as long as it keeps doing what it is meant to do, I do not plan on looking elsewhere. I need software to be stable and NinjaOne is stable.
We migrated away from our 20-year-old homegrown solution and have no back-tracking capability. ScienceLogic is demonstrating new capabilities that we would not have been able to do on our own using our legacy system. We understand the capabilities of competitors based on our bake-off selection where ScienceLogic won on capabilities and future near-term potential (expandability, platform growth). We know that those competitors are not really close to where we have been able to push ScienceLogic (as a partner).
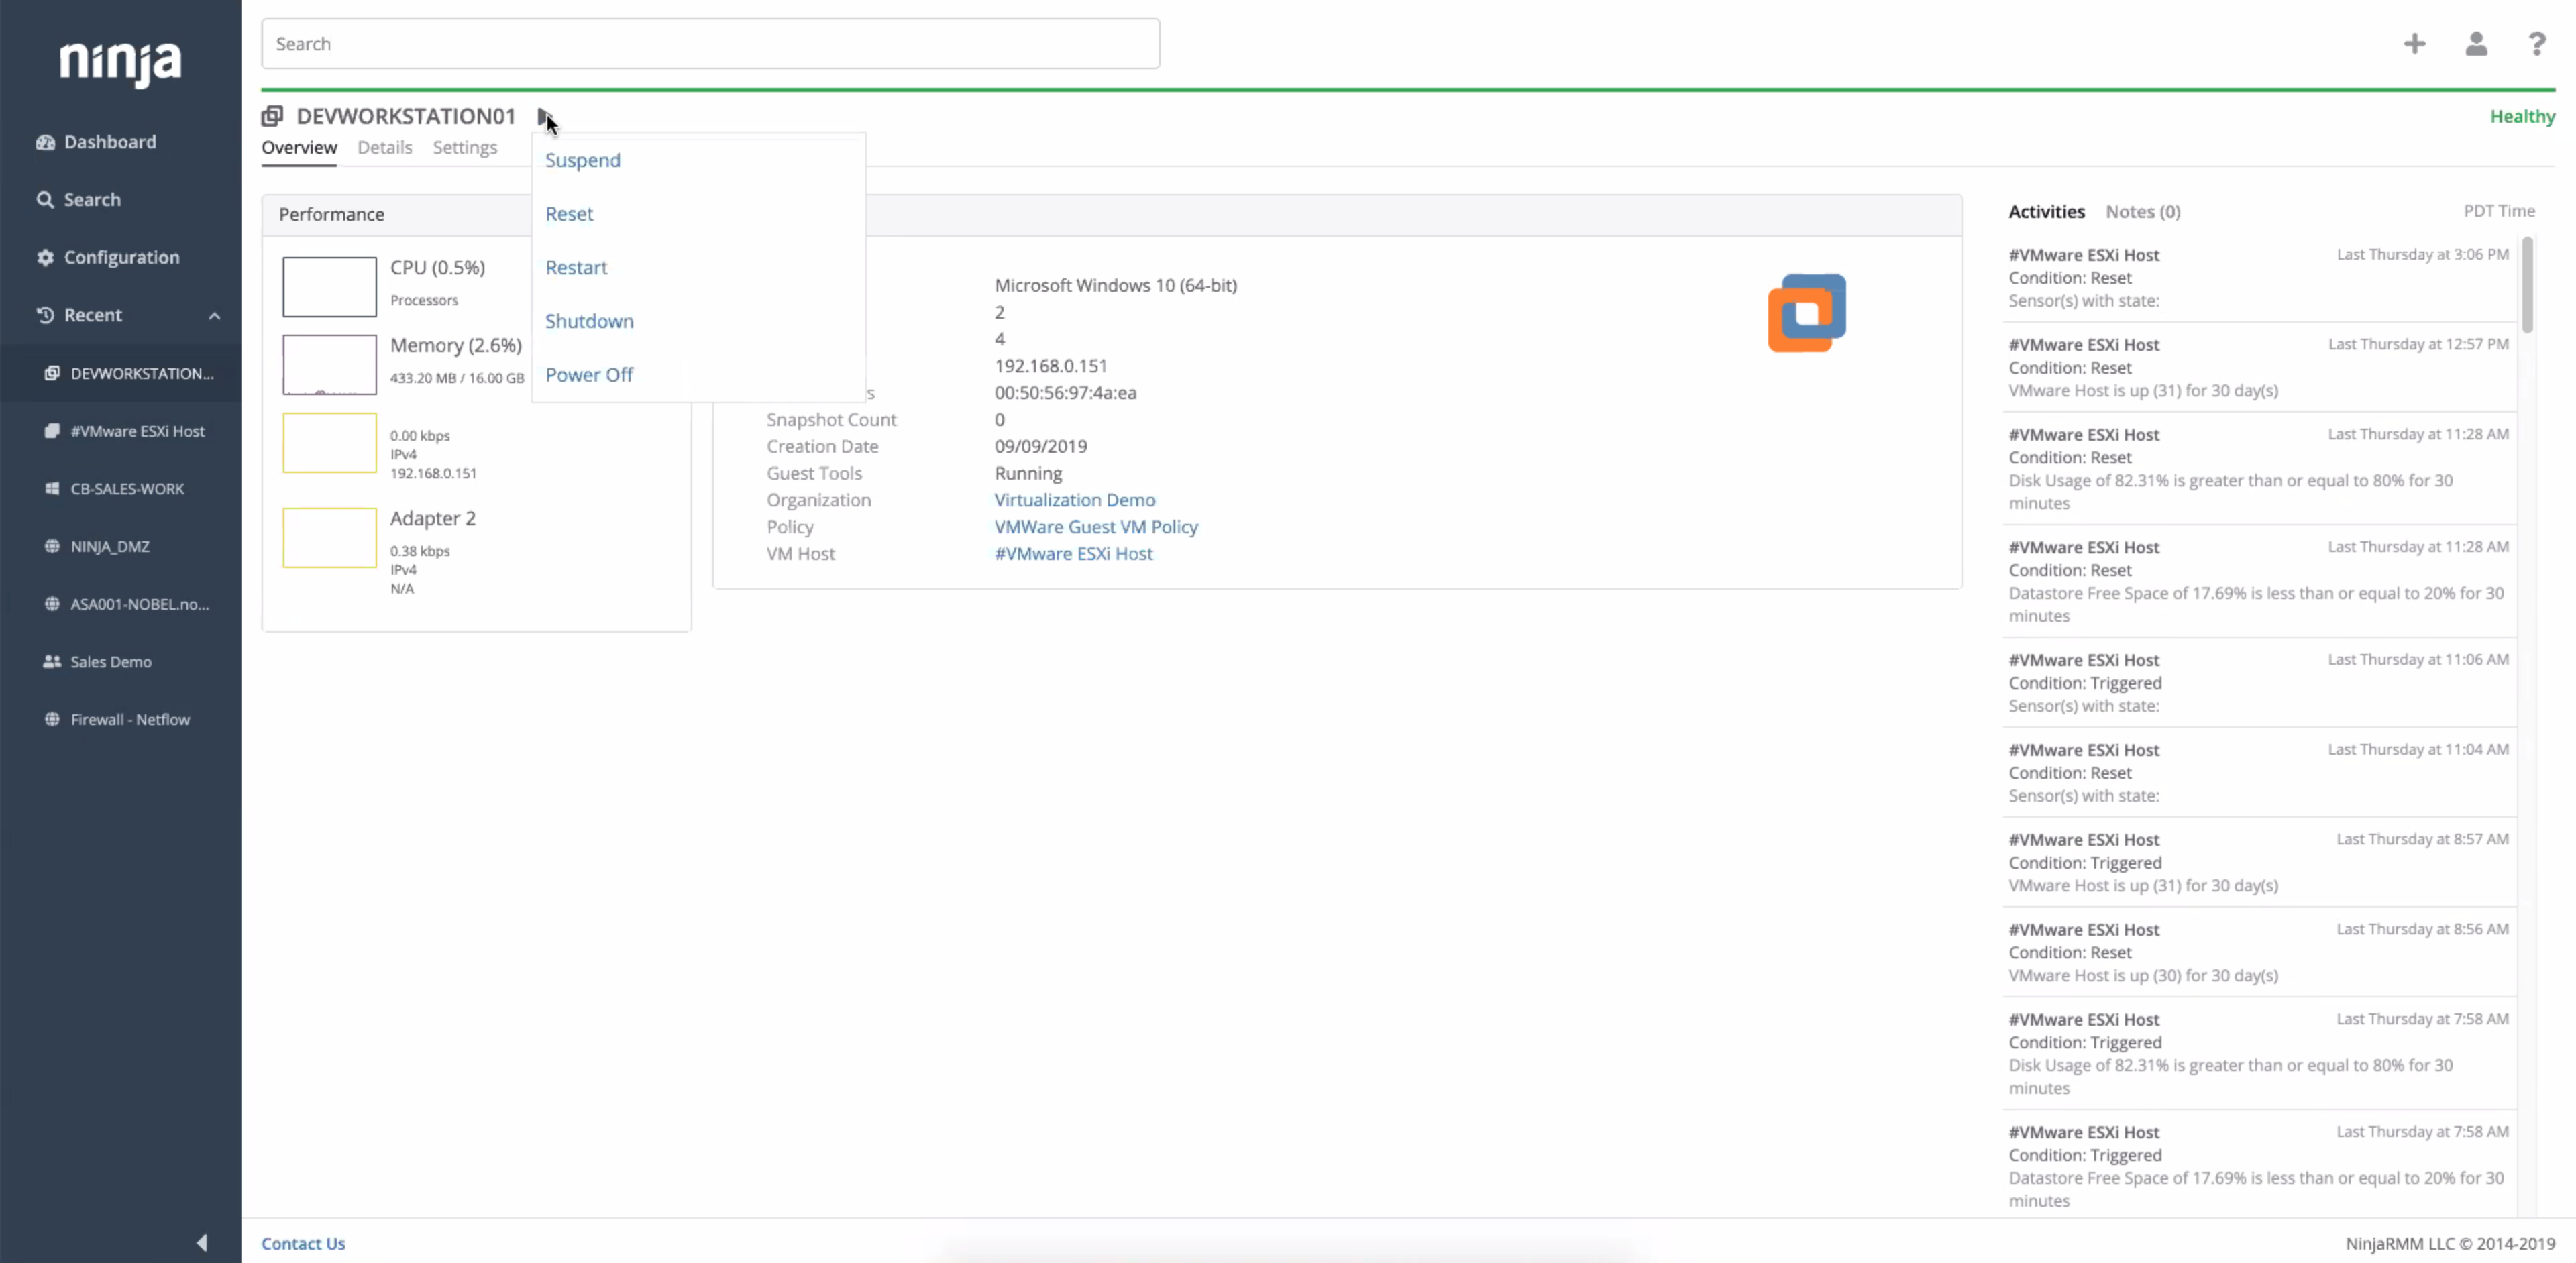
Ninja's interface is clean and simple. Overall usability from an interface perspective is good. Some items, policies and scripting for instance, are a bit cumbersome and it's really not clear how to implement with a best practice mind-site. Ninja RMM got the job done for us but as we pushed our needs more into automation and efficiency we felt it wasn't keeping up with our speed of growth. There is definitely usability in the product, and it will get the job done, but there are other RMM's out there that fit better in our business.
We use ScienceLogic SL1 in our organization to serve effective monitoring solutions to our external customers. Our customers depend upon us for critical events/alerts related to their IT infrastructure gears and using SL1, we're able to provide them with a proactive monitoring solution that resolves an issue before an impact is noticed by the customer. There are very few monitoring solutions that can cater to a variety of Cloud platforms like Public Cloud (AWS, Azure) and private cloud simultaneously and SL1 addresses this business problem very well
Science Logic SL1 provides the option of Distributed deployment where multiple instances of each appliance can be deployed to manage the load and availability. SL1 provides a High Availability feature for Database Servers and Data Collection. If one of the Data Collectors in the collector group fails, it will automatically redistribute the devices from the failed Data Collector among the other Data Collectors in the Collector Group. The high availability feature for the Database server ensures that SL1 performs failover automatically to another server without causing the outage to the application.
The performance is entirely dependent on the complexity of the environment/network being used to host the platform. Outside of those factors, the platform runs very efficiently and quickly out of the box. We have integrations with other platforms and neither seem to take a hit from our moderate API usage. Any issues with performance would be experienced by choices made in infrastructure or complexity of things built by the customer to display in the GUI (overly complicated and cluttered dashboards for example)
Support has been very responsive and my account rep Brian K. has communicated with me continuously making sure we had everything we need. Not like other MDMs where they sign you up and that's the last you hear from them. NinjaOne makes sure you use the product to its best application and you are successful and continue as the product features grow.
So far, it's good as part of my overall experience, except for a couple of use cases. The support team is well knowledgeable, has technical sound, and is efficient. When support escalates to engineering, the issue gets stuck and takes months to resolve.
When I joined our company, I did not know about the in person training at firts. Logging onto the SL University, I realised that there were different sessions being held at different times throughout the year. The training itself was good, but being in a different time zone, made it difficult to attend, but the sessions that I attended was great!
There are a lot of educational materials and courses on the SL1 training site (Litmos university). However the recording quality is sometimes not very good - screen resolution is low. There is a lack of professional rather than user-oriented documents and there are mistakes in documentation and education is not well structured.
Love to use Science logic tool as our first monitoring tool to provide services to the customer. Auto restart feature in Sl1 will allow us to get event when those crucial services has not started after server reboots and also minimize the P1's that we have as a result of that.
NinjaOne has more overall features than these competitors bundled in their package. Both of these other products have separate add-ons that will accomplish the additional features that NinjaOne bundles in. While it seems that both may be slightly more powerful when it comes to the overall RMM software, NinjaOne has a much cleaner UI and makes it much easier to work in. NinjaOne also seems to always be growing and implementing solutions that customer ask for, without any additional up-charges. These competitors seem to have their finished product and additional add-ons like ticketing are completely separate offerings that are both separate charges and a completely different product all together
Science logic SL1 is so user friendly and it's really easy to navigate between function. I would recommend Sciene logic SL1 to all of them who are looking for really useful monitoring tool and expecting easy way of managing it.
Our deployment model is vastly different from product expectations. Our global / internal monitoring foot print is 8 production stacks in dual data centers with 50% collection capacity allocated to each data center with minimal numbers of collection groups. General Collection is our default collection group. Special Collection is for monitoring our ASA and other hardware that cannot be polled by a large number of IP addresses, so this collection group is usually 2 collectors). Because most of our stacks are in different physical data centers, we cannot use the provided HA solution. We have to use the DR solution (DRBD + CNAMEs). We routinely test power in our data centers (yearly). Because we have to use DR, we have a hand-touch to flip nodes and change the DNS CNAME half of the times when there is an outage (by design). When the outage is planned, we do this ahead of the outage so that we don't care that the Secondary has dropped away from the Primary. Hopefully, we'll be able to find a way to meet our constraints and improve our resiliency and reduce our hand-touch in future releases. For now, this works for us and our complexity. (I hear that the HA option is sweet. I just can't consume that.)
Once a powerpack is developed and configured for a device for one customer, it is easy to deploy the same powerpack on a second customer estate and configure specifically for that customer without having to reinvent the powerpack. This saves time and therefore money.
Once the customer estate tuning is complete, the Operations team have come trust the alerts. This is especially true when transient or self-correcting alerts are automatically cleared without ops team involvement, but a record is still available for audit and debugging purposes. This saves time and therefore money.
When setup correctly, it provides good visibility into applications, devices and whole customer estates. This saves time and therefore money when issues arise.