Chose Microsoft Power BI
Microsoft Power BI vs. SAP Lumira Discovery
Microsoft Power BI vs. SAP Lumira Discovery
| Product | Rating | Most Used By | Product Summary | Starting Price |
|---|---|---|---|---|
 Microsoft Power BI | N/A | Microsoft Power BI is a visualization and data discovery tool from Microsoft. It allows users to convert data into visuals and graphics, visually explore and analyze data, collaborate on interactive dashboards and reports, and scale across their organization with built-in governance and security. | $10 per month per user | |
 SAP Lumira Discovery | N/A | SAP Lumira Discovery is SAP’s data visualization and discovery application. It facilitates data discovery, visualization, and analysis by assisting users with creation of dashboards, infographics, presentations, data facets, tag clouds, and more. | $185 per user |
| Microsoft Power BI | SAP Lumira Discovery | |||||||||||||||
|---|---|---|---|---|---|---|---|---|---|---|---|---|---|---|---|---|
| Editions & Modules | No answers on this topic |
| ||||||||||||||
| Offerings |
| |||||||||||||||
| Entry-level Setup Fee | No setup fee | No setup fee | ||||||||||||||
| Additional Details | — | — | ||||||||||||||
| More Pricing Information | ||||||||||||||||
| Microsoft Power BI | SAP Lumira Discovery | |
|---|---|---|
| Considered Both Products | Microsoft Power BI  Kevin Lee Elder Associate Professor Chose Microsoft Power BI Much easier learning curve and integration with Microsoft Office gives it a leg up. People not knowing they have it, believe it or not, is limiting it's usage. Microsoft really needs to market it! | SAP Lumira Discovery  Frédérick Samson Software Architect Chose SAP Lumira Discovery  Avishek Chakraborty Solutions Architect Chose SAP Lumira Discovery Easy to use, one time license cost, close integration with BI/BO, custom user story for case based data presentation.  Sukhdeep Talwar Quality Analyst Chose SAP Lumira Discovery SAP Lumira is expensive for my application. I don't have much data to visualize. |
| Top Pros | ||
| Top Cons |
|
| Microsoft Power BI | SAP Lumira Discovery | |||||||||||||||||||||
|---|---|---|---|---|---|---|---|---|---|---|---|---|---|---|---|---|---|---|---|---|---|---|
| BI Standard Reporting |
| |||||||||||||||||||||
| Ad-hoc Reporting |
| |||||||||||||||||||||
| Report Output and Scheduling |
| |||||||||||||||||||||
| Data Discovery and Visualization |
| |||||||||||||||||||||
| Access Control and Security |
| |||||||||||||||||||||
| Mobile Capabilities |
| |||||||||||||||||||||
| Application Program Interfaces (APIs) / Embedding |
|
| Microsoft Power BI | SAP Lumira Discovery | |
|---|---|---|
| Small Businesses |  BrightGauge Score 8.9 out of 10 | BrightGauge Score 8.9 out of 10 |
| Medium-sized Companies |  Reveal Score 9.9 out of 10 | Reveal Score 9.9 out of 10 |
| Enterprises |  Jaspersoft Community Edition Score 9.7 out of 10 | Jaspersoft Community Edition Score 9.7 out of 10 |
| All Alternatives | View all alternatives | View all alternatives |
| Microsoft Power BI | SAP Lumira Discovery | |
|---|---|---|
| Likelihood to Recommend | 7.9 (140 ratings) | 6.8 (104 ratings) |
| Likelihood to Renew | 10.0 (1 ratings) | - (0 ratings) |
| Usability | 9.0 (56 ratings) | 7.8 (14 ratings) |
| Availability | - (0 ratings) | 9.0 (1 ratings) |
| Performance | - (0 ratings) | 7.0 (1 ratings) |
| Support Rating | 7.9 (52 ratings) | 7.0 (11 ratings) |
| In-Person Training | - (0 ratings) | 6.0 (1 ratings) |
| Online Training | - (0 ratings) | 6.0 (1 ratings) |
| Implementation Rating | - (0 ratings) | 10.0 (3 ratings) |
| Configurability | - (0 ratings) | 2.0 (1 ratings) |
| Ease of integration | - (0 ratings) | 5.0 (1 ratings) |
| Product Scalability | - (0 ratings) | 6.0 (1 ratings) |
| Vendor post-sale | - (0 ratings) | 8.0 (1 ratings) |
| Vendor pre-sale | - (0 ratings) | 8.0 (1 ratings) |
| Microsoft Power BI | SAP Lumira Discovery | |
|---|---|---|
| Likelihood to Recommend | Microsoft
| SAP
|
| Pros | Microsoft
 Afia Tamanna Information Technology Business Consultant | SAP
|
| Cons | Microsoft
| SAP
 Darian Rawson Senior Designer |
| Likelihood to Renew | Microsoft
 jim paroly Freelance Photographer | SAP No answers on this topic |
| Usability | Microsoft
| SAP
|
| Reliability and Availability | Microsoft No answers on this topic | SAP
 Ravi Ada Founder + CTO |
| Performance | Microsoft No answers on this topic | SAP
Ravi Ada Founder + CTO |
| Support Rating | Microsoft
 Greg Watkins Senior Customer Success Manager (Strategic Accounts) | SAP
|
| In-Person Training | Microsoft No answers on this topic | SAP
Ravi Ada Founder + CTO |
| Online Training | Microsoft No answers on this topic | SAP
Ravi Ada Founder + CTO |
| Implementation Rating | Microsoft No answers on this topic | SAP
Ravi Ada Founder + CTO |
| Alternatives Considered | Microsoft
 Dustin Ghia Lead Consultant - Solutions Architect - Software Engineer | SAP
|
| Scalability | Microsoft No answers on this topic | SAP
Ravi Ada Founder + CTO |
| Return on Investment | Microsoft
 christian Maxwell Process Manager | SAP
 Rehan Kanuga Data Analyst |
| ScreenShots | Microsoft Power BI Screenshots      | SAP Lumira Discovery Screenshots 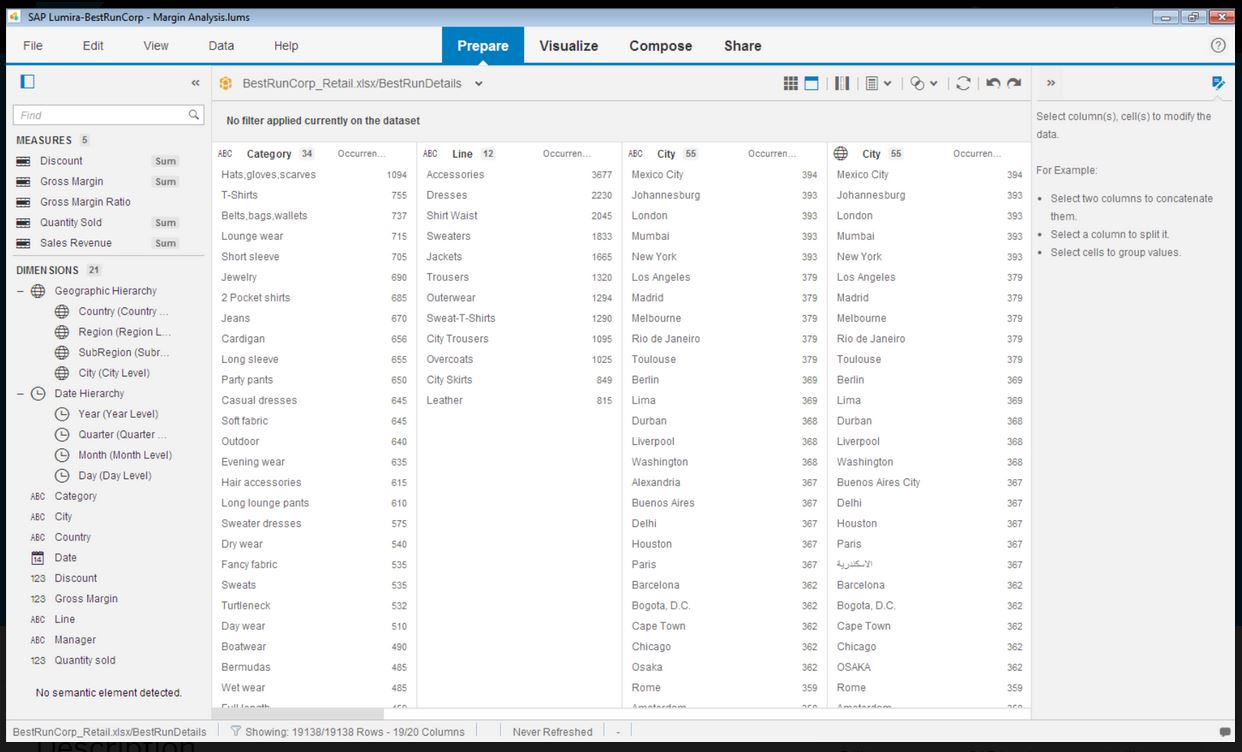     |