QlikView® is Qlik®’s original BI offering designed primarily for shared business intelligence reports and data visualizations. It offers guided exploration and discovery, collaborative analytics for sharing insight, and agile development and deployment.
N/A
Zoho Analytics
Score 8.0 out of 10
Small Businesses (1-50 employees)
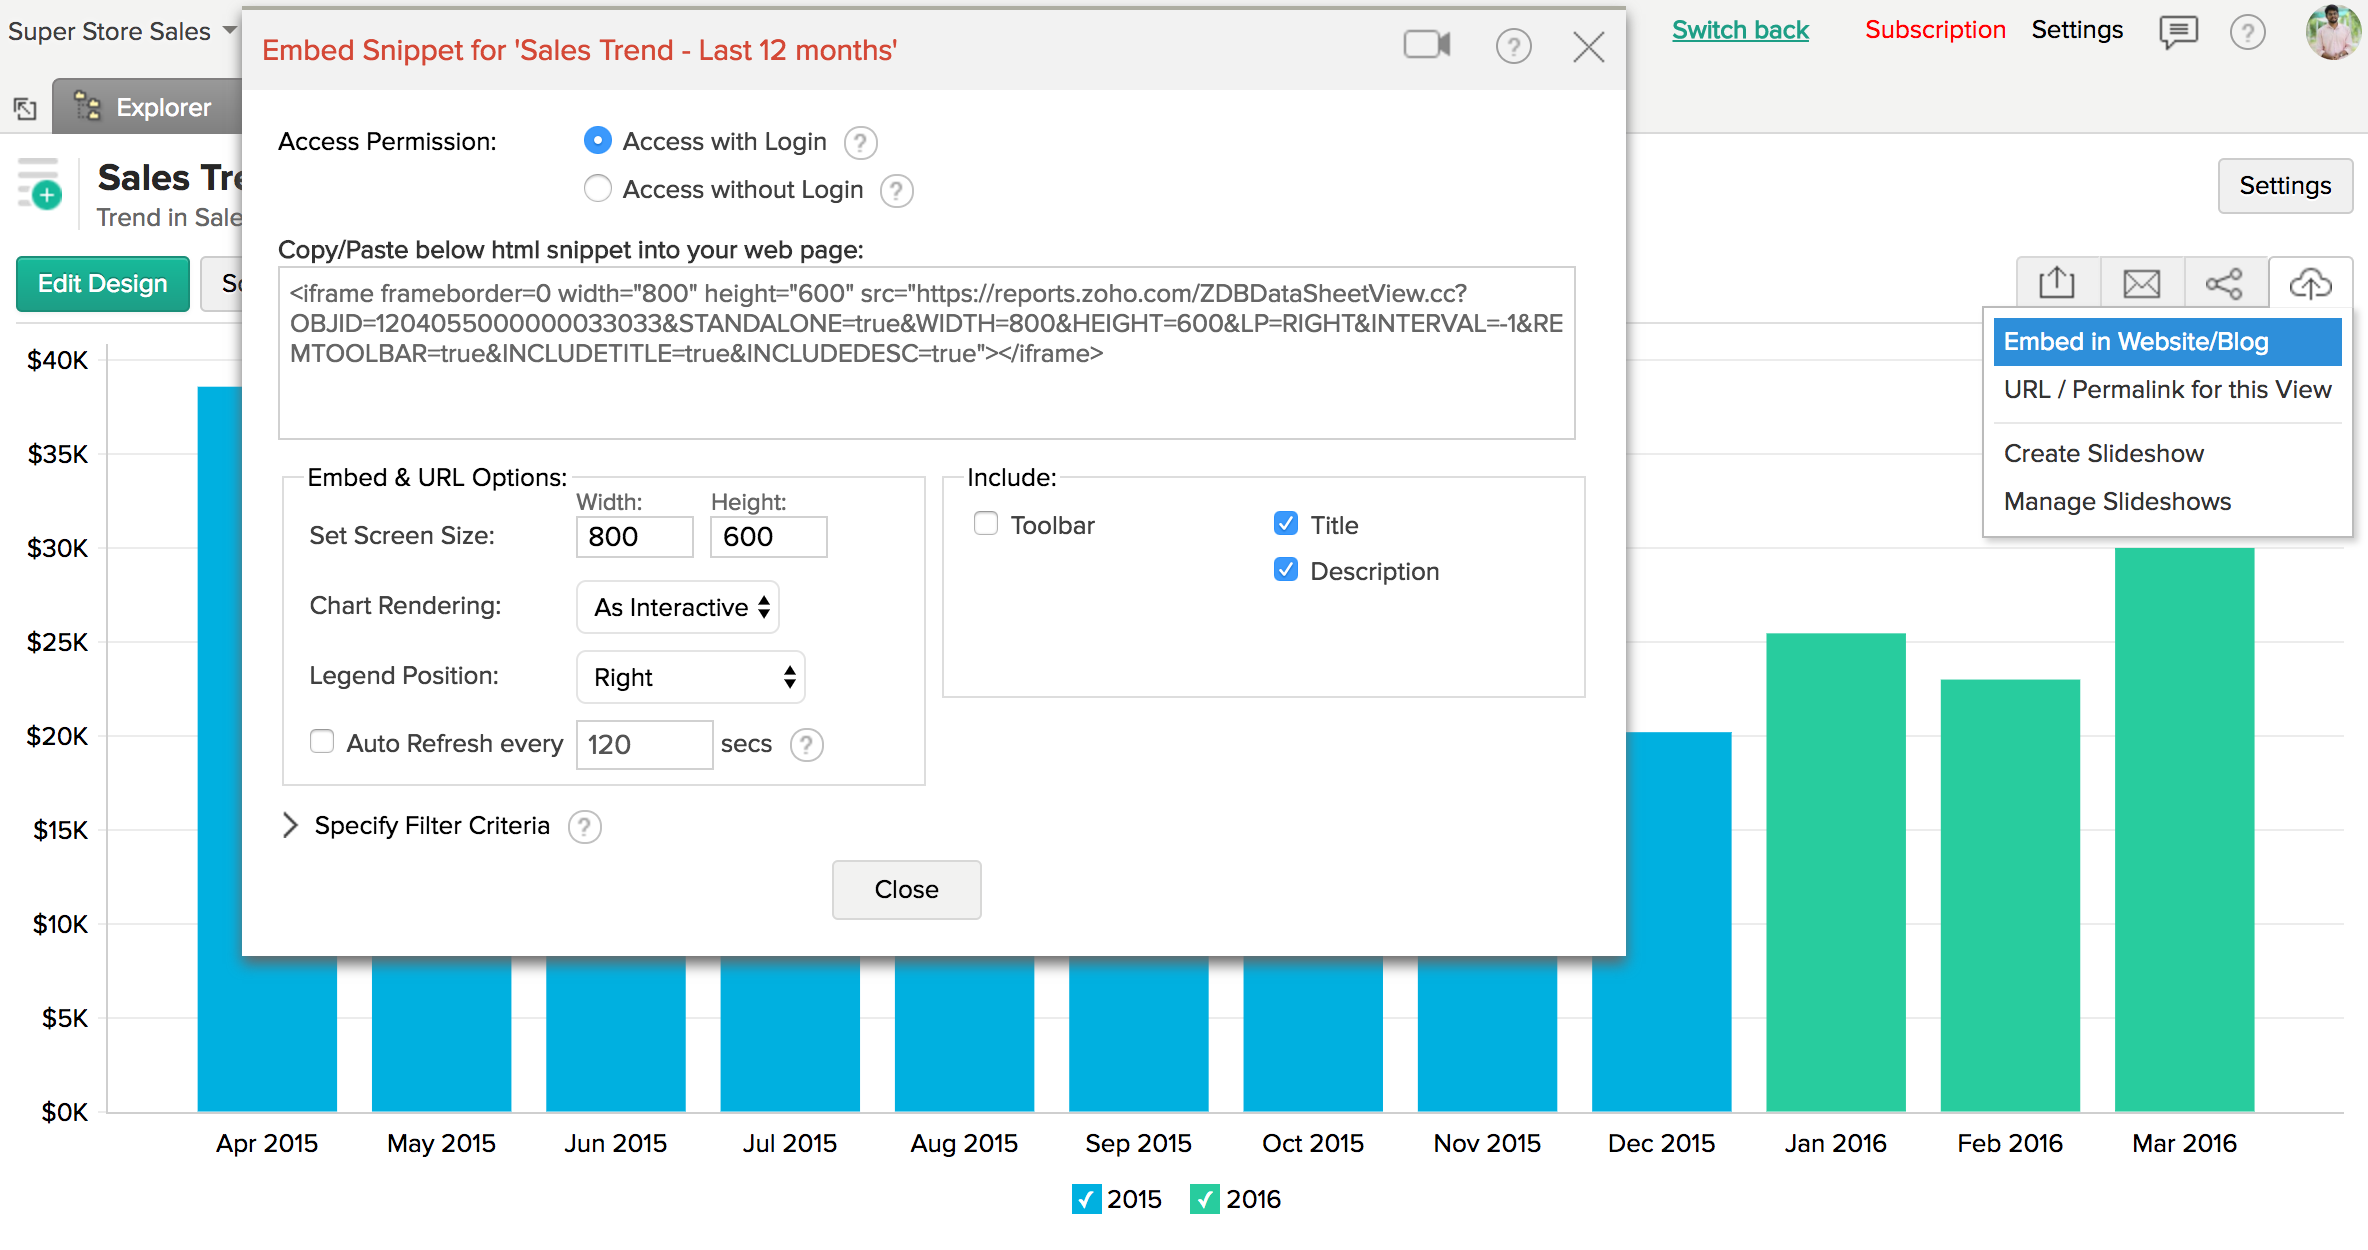
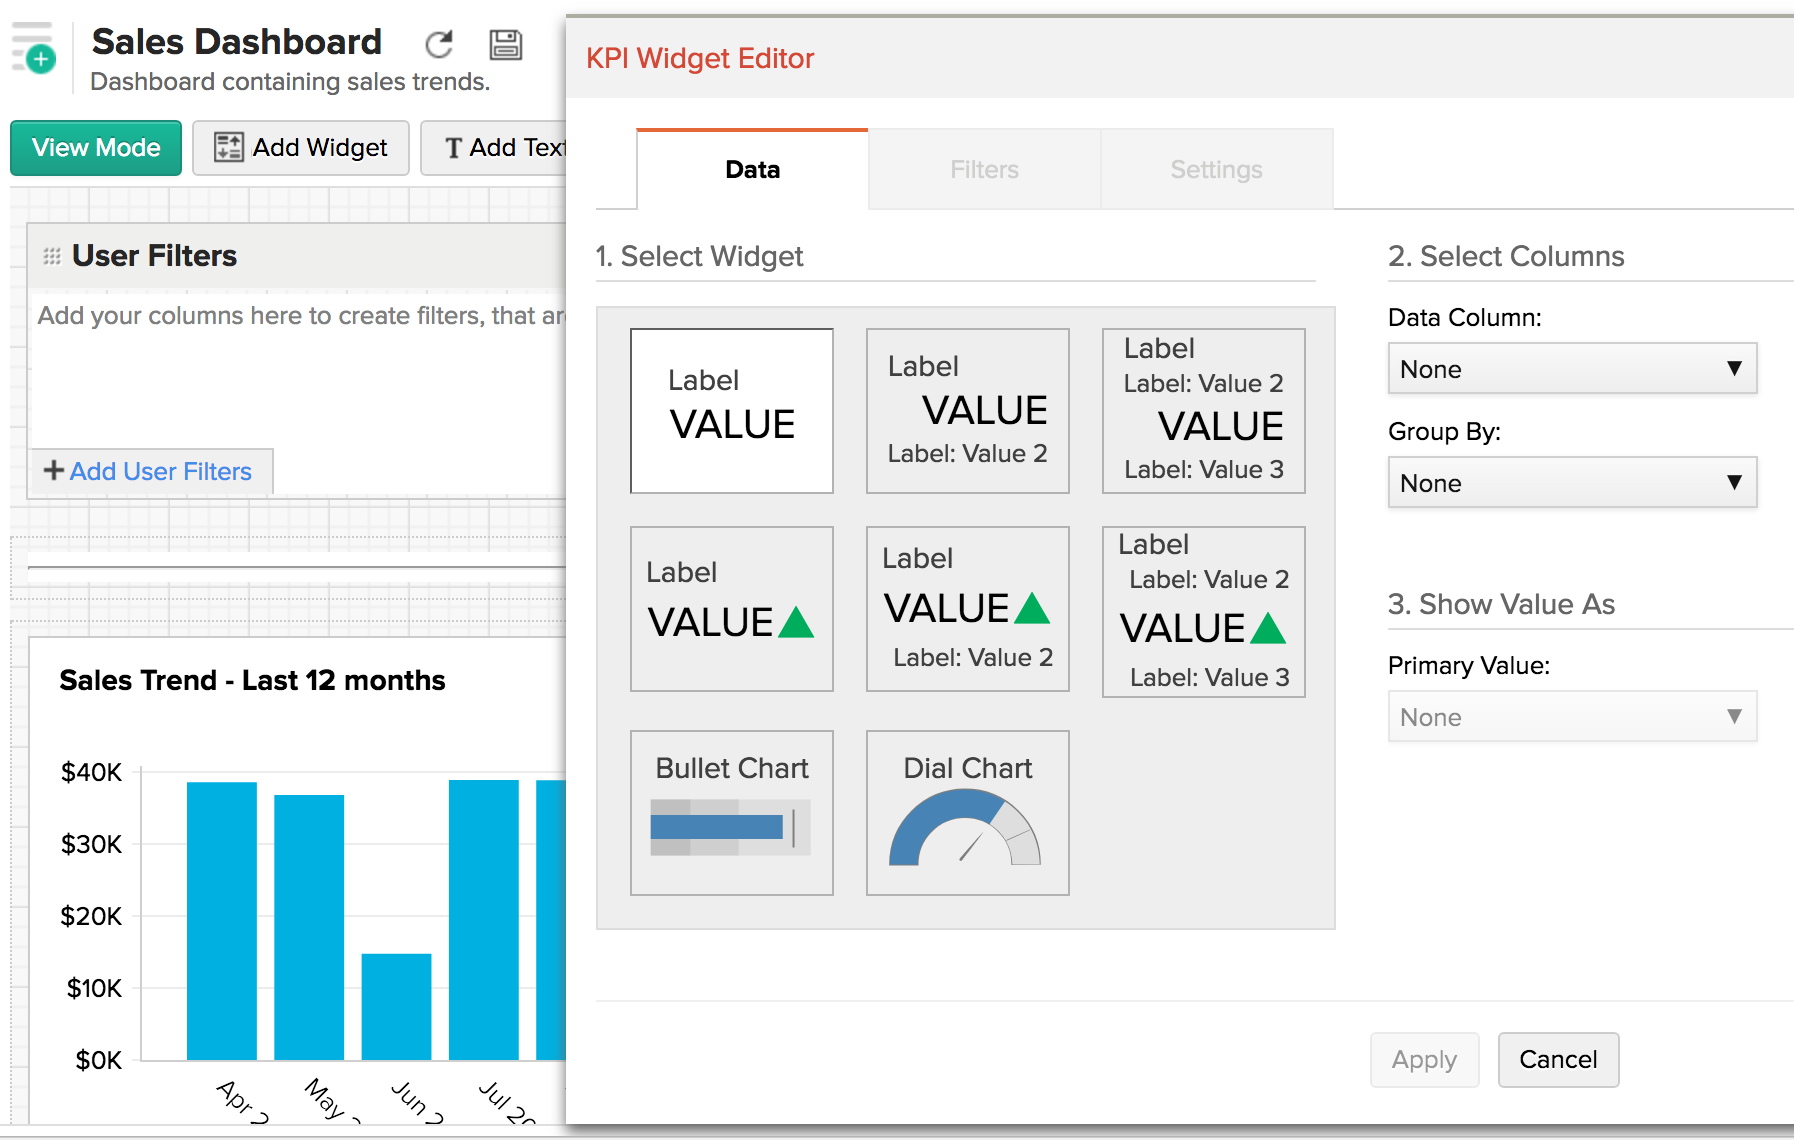
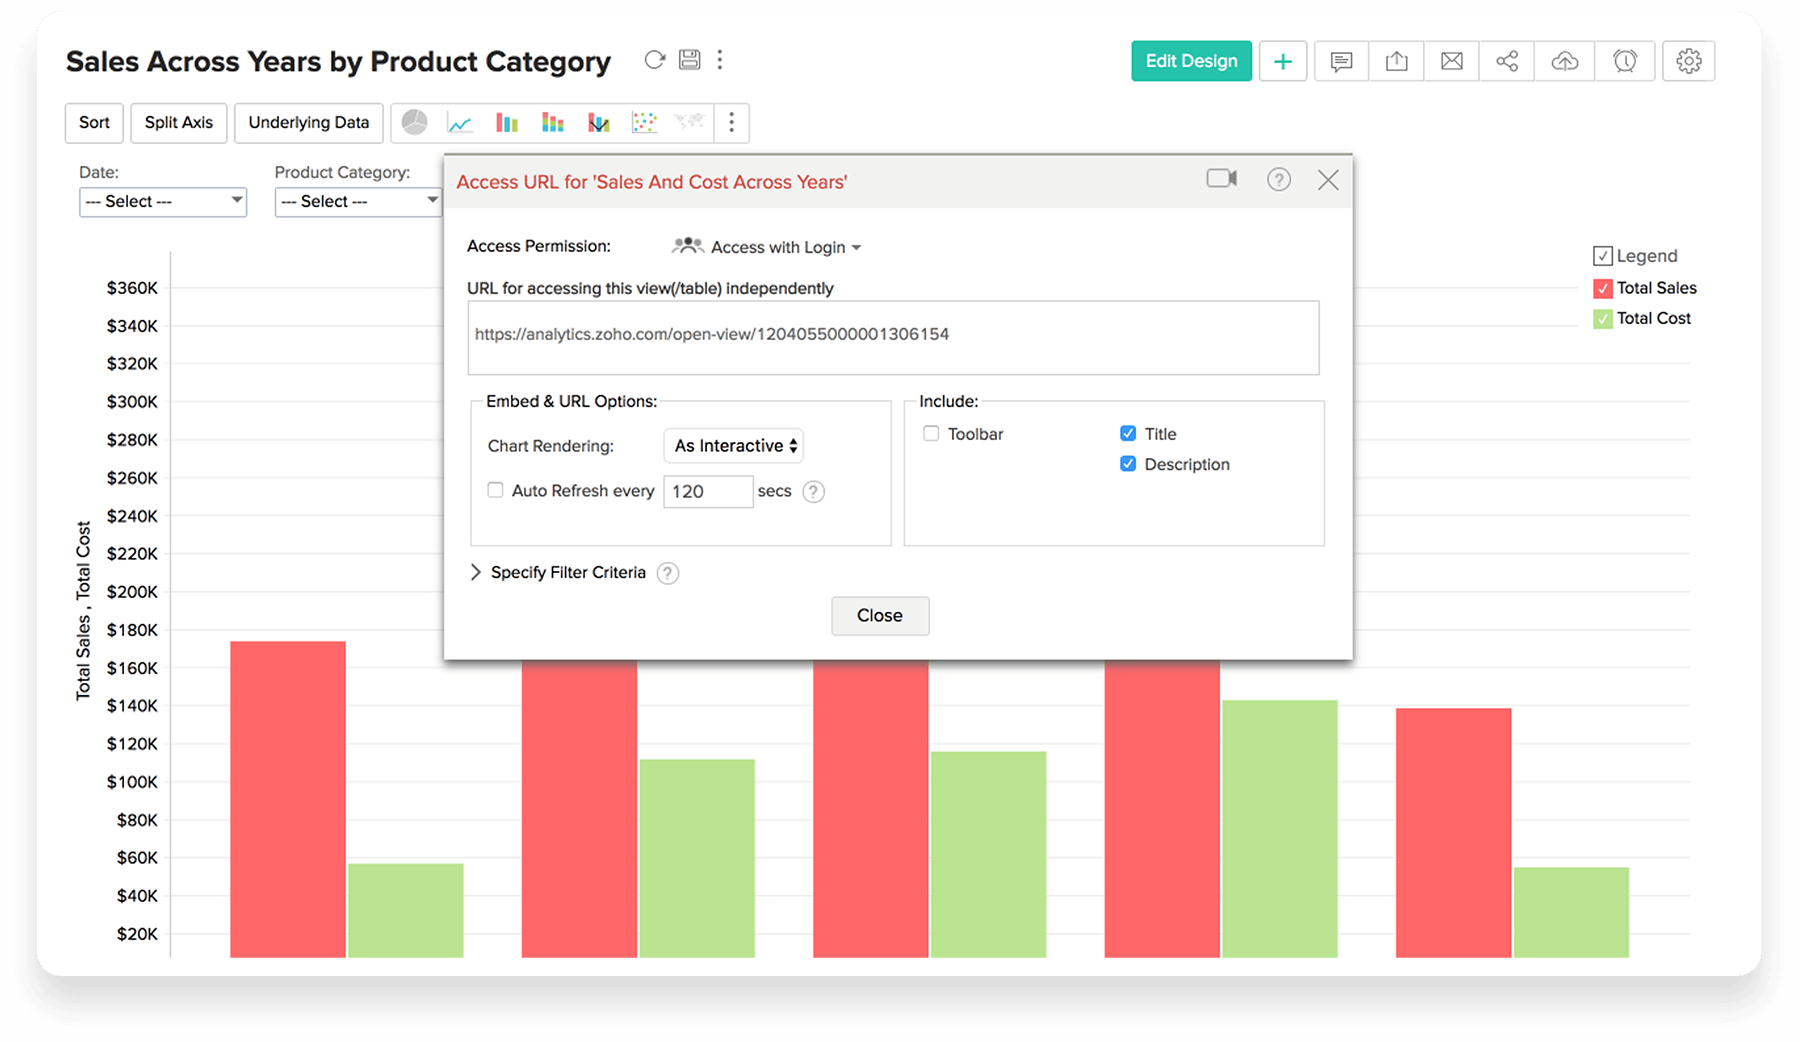
Zoho Analytics (formerly Zoho Reports) is a self-service BI and analytics platform that allows users to analyze their business data and create reports and dashboards. It is designed to help users create and share reports quickly, without IT assistance.
$50
per month
Pricing
QlikView
Zoho Analytics
Editions & Modules
QlikView
Custom
per user
Basic
$30
0.5M rows, 2 users
Professional
$30
per user per month billed annually
Standard
$60
1M rows, 5 users
Premium
$145
5M rows, 15 users
Enterprise
$575
50M rows, 50 users
Offerings
Pricing Offerings
QlikView
Zoho Analytics
Free Trial
Yes
Yes
Free/Freemium Version
No
Yes
Premium Consulting/Integration Services
Yes
Yes
Entry-level Setup Fee
Optional
No setup fee
Additional Details
On an perpetual license basis, based on server plus number of users.
Contact vendor for pricing.
There is a 20% discount for all plans if subscribed yearly. Customers can buy add-on rows and users, in addition to the plans listed above.
With QlikView and Qlik Sense the users can answer their own questions more interactively. They also can build their own visualizations without waiting [for] someone from IT to create a new report. The users can navigate through the data finding out relevant information. Through …
I selected Zoho Reports because of the Zoho ecosystem. We adopted it because it seamlessly combines with the Zoho task management application, Zoho Projects. This was a unique offering since many project applications have poor or limited reporting features or not a standalone …
Sales data validations have helped manage our justifications in the past, especially with regard to new product development and new business introduction. It has also been helpful in identifying trends with business impact and direction specific to quarter and monthly sales from ERP data as well as decisions to purchase equipment of staffing based on run rates and product demand.
One thing that can get out of hand is data output - if you aren't careful in your query, you may be overloaded with data dumps and drown in the amount of info you have to filter through. This is a user caution, not a comment on the software itself.
If you've got multiple applications to pull data from, Zoho Analytics is key. As soon as you get beyond hundreds, and into thousands of rows, I'd say you need a tool like Zoho Analytics. We've used it to analyze millions of rows and the engine seems to work well. If you've been able to utilize Excel to create visualizations, you'll find Zoho Analytics to be much more user friendly, in my opinion
It gives a single unified view everyday for our sales team to look at to track their progress and the progress of their peers in achieving the targets
It helps Account Executives to analyse their sales pipeline and find out the score for each deal and any high potential deal that is not getting enough attention
Some of our consultants have built very powerful stories on how and what impacts sales using storyboards and they are well understood by senior leadership
We found that QlikView can be a bit slow in supporting some forms of encryption. It is web-based and we needed to upgrade all of our server to not support the older SSL and TLS 1 protocols, only support TLS 1.2 and TLS 1.3. However, QlikView could not run with TLS 1.2 and TLS 1.3. We had to wait over six months to get a version that would handle the newer TLS versions.
There are so many options with QlikView that you can get lost when developing a visualization. There are still items I have not yet figured out, such as labeling a graph with the name of a selected detail item.
QlikView works by pulling the data it is going to use for visualization into its database. I am a security reviewer and I need to make certain that PII and PHI is not pulled by QlikView for a visualization, otherwise this could become a reportable indecent.
Ease of use, ability to load from pretty much any data source. today I created an application that loaded time sheets from excel that are not in a table format. With Qlik's "enable transformation steps" I was able to automate loads of multiple spreadsheets and multiple tabs easily. Could not do that with any other tool.
I'd give this an 11 if I could! As our business moves forward we hope to use Zoho Analytics more then we do now. Creating better reports and dashboards for our management team to evaluate the health of our business and to provide more insightful reports for our customers. The possibilities are endless with this tool
QlikView is very easy to implement. The installation is very straight forward. QlikView has several different data connectors that can connect to different data sources very smoothly. The user interface to build the reports is very easy to understand. This helps to have a smaller learning curve. Something very helpful is that QlikView is a browser application for the end users. So, you don't need to install any applications on the user's computer.
Zoho Analytics for ease of use and the overall end-user experience. It helps in maintaining data base and creating customized logical data. Report preparation becomes easy, and the visual representation creates a magical presentation. The meaningful data help in business analytics and projections helpful for planning futuristic strategy with the help of Data modelling and figures
ZOHO is a very reliable company/product. We never had any issues with downtime or inaccessibility to our data. Any type of maintenance that they had to perform was clearly communicated and never an issue. We use a lot of external hooks and we've never had any issues with getting ZOHO to communicate with any of those hooks.
ZOHO has obviously invested a lot of time effort and money in to creating a reliable infrastructure with high availability. We've never had any issues with performance and all of our data crunching small to large has always been well within reason. We have come to appreciate the performance of ZOHO and will continue to use it for all of our data needs.
My experience with the Qlik support team has been somewhat limited, but every interaction I have had with them has been very professional and I received a response quickly. Typically if there is a technical issue, our IT team will follow up. My inquiries are specific to product functionality, and Qlik has been very helpful in clarifying any questions I might have.
The support team is honestly not that great. At times, it seems as if members of our own team know more about the product than the support team. They must not have a lot of training or the turnaround is quick
My team attended, but I cannot myself rate, but I think it was good as they've successfully launched a training program at our company themselves for users. It was 3-4 day training.
Training was as expected. The demo environments tend to be more fully featured that our own environment, but the training was clear and well delivered.
"Implementation" can mean a few things... so I'm not sure that this is the answer you want.... but here it goes: To me, implementation means: "Is the user interface intuitive and can I produce meaningful reports with ease?" On that score, I'd say YES. The amount of training required was minimal and the results were powerful. The desktop implementation is a simple, "blank" interface just waiting for your creativity. The pre-populated templates give you a reasonable start to any project -- and a good set of objects to "play around with" if you're just getting started. Finally, note that the "implementation" I used was baked into QuickBooks 2016 Enterprise -- called "Advanced Reporting"..... That integration makes it ultra useful and simple.
If your external data sources are previously organized and correlated (e.g.: in your datawarehouse or database) your implementation will be easier. Of cource some not previously predicted correlation would be necessary to be done during the implementation, but if your organization let it to be all done into Zoho Analytics, it will take more time from your team.
The only other vendor product that I have worked with that provides a similar experience to Qlikview is Tableau. I would recommend Tableau if your use case is to build a fixed dashboard. You can share reports for free without needing to buy additional licenses. I would recommend Qlikview if your users are looking for a more interactive experience. They can create new objects to represent the data which can't be accomplished as easily in Tableau
We used Yellowfin for 1 year and it really doesn't compare to Zoho Analytics because it doesn't have the native integration with ManageEngine's tools and the customization is more technical, Zoho Analytics lets you create dashboards automatically, immediately when you connect the data source (no matter if that is a MSSQL database, URL or an XLS file), maybe you will require custom some details in the dashboard, but it's not compared to create it from zero.
I have not really had problems with the operation of the platform; when I accessed it, I managed to do the work in the ideal times. The statistical development responds very quickly to the user’s requirements, and it is easy to extract the data to make the particular combinations that interest the industry.
You can use the free desktop version to do a lot of reporting and analysis work more quickly so the ROI is huge
QlikView is great at finding outliers such as data entry errors
QlikView is great at helping you quickly discover new insights about your business that can prompt you to take action that can immediately affect your cash flow.