
Gabriel Chiararia
Marketing Manager, Category Management
Chose Posit
Pros:
- Free
- Huge repository of models and library, constantly updated
- Free
- Huge repository of models and library, constantly updated
| Product | Rating | Most Used By | Product Summary | Starting Price |
|---|---|---|---|---|
 Posit | N/A | Posit, formerly RStudio, is a modular data science platform, combining open source and commercial products. | N/A | |
 Tableau Desktop | N/A | Tableau Desktop is a data visualization product from Tableau. It connects to a variety of data sources for combining disparate data sources without coding. It provides tools for discovering patterns and insights, data calculations, forecasts, and statistical summaries and visual storytelling. | $70 per month |
| Posit | Tableau Desktop | |||||||||||||||
|---|---|---|---|---|---|---|---|---|---|---|---|---|---|---|---|---|
| Editions & Modules | No answers on this topic |
| ||||||||||||||
| Offerings |
| |||||||||||||||
| Entry-level Setup Fee | Optional | No setup fee | ||||||||||||||
| Additional Details | — | All pricing plans are billed annually. | ||||||||||||||
| More Pricing Information | ||||||||||||||||
| Posit | Tableau Desktop | |
|---|---|---|
| Considered Both Products | Posit Gabriel Chiararia Marketing Manager, Category Management Chose Posit Pros: - Free - Huge repository of models and library, constantly updated  Suryaprakash Mishra Senior Data Analyst, Research, Insights and Evaluation, Road Safety Division Chose Posit Amazon QuickSight, Power bi, SAS EG, Tableau, Salesforce (TREVI) - Victoria, SharePoint.  Kunal Sonalkar Data Research Analyst Chose Posit  Chris Beeley Senior Analyst Chose Posit There are loads of people in the BI (Business Intelligence) space, of course... but I wouldn't touch any of them because none of them offer anything like the R and Python support that RStudio does. RStudio publishes open-source, they're a public benefit corporation, and they …  Prashast Vaish Decision Scientist Chose Posit RStudio is as good as any software available in the market and is better off than some as it is free. Since it is open source it is improving day by day. I would prefer RStudio over any other tool any day. I would recommend every data analyst to give RStudio a try.  Heramb Gadgil Data Scientist Chose Posit RStudio is the only R-friendly IDE. None of the IDEs, even though they offer R-plugins, are as intuitive as RStudio.  Peter Higgins Professor Chose Posit [RStudio is] so much more flexible.  Akshaya Bhardwaj Consultant Chose Posit It has the same capabilities as the other mentioned tools. 1)It is freely available. 2)Generates good quality of results.  Leah Jakaitis Senior Data Analyst Chose Posit |  Tableau Desktop |
| Top Pros | ||
| Top Cons |
|
|
| Posit | Tableau Desktop | |||||||||||||||||||||
|---|---|---|---|---|---|---|---|---|---|---|---|---|---|---|---|---|---|---|---|---|---|---|
| Platform Connectivity |
| |||||||||||||||||||||
| Data Exploration |
| |||||||||||||||||||||
| Data Preparation |
| |||||||||||||||||||||
| Platform Data Modeling |
| |||||||||||||||||||||
| Model Deployment |
| |||||||||||||||||||||
| BI Standard Reporting |
| |||||||||||||||||||||
| Ad-hoc Reporting |
| |||||||||||||||||||||
| Report Output and Scheduling |
| |||||||||||||||||||||
| Data Discovery and Visualization |
| |||||||||||||||||||||
| Access Control and Security |
| |||||||||||||||||||||
| Mobile Capabilities |
| |||||||||||||||||||||
| Application Program Interfaces (APIs) / Embedding |
|
| Posit | Tableau Desktop | |
|---|---|---|
| Small Businesses |  IBM SPSS Modeler Score 7.8 out of 10 |  BrightGauge Score 8.9 out of 10 |
| Medium-sized Companies |  Mathematica Score 8.2 out of 10 |  Reveal Score 9.9 out of 10 |
| Enterprises | IBM SPSS Modeler Score 7.8 out of 10 |  Jaspersoft Community Edition Score 9.7 out of 10 |
| All Alternatives | View all alternatives | View all alternatives |
| Posit | Tableau Desktop | |
|---|---|---|
| Likelihood to Recommend | 9.1 (122 ratings) | 8.9 (194 ratings) |
| Likelihood to Renew | 9.7 (17 ratings) | 8.9 (39 ratings) |
| Usability | 10.0 (3 ratings) | 8.6 (63 ratings) |
| Availability | 9.4 (3 ratings) | 8.0 (10 ratings) |
| Performance | - (0 ratings) | 6.1 (9 ratings) |
| Support Rating | 8.9 (9 ratings) | 6.9 (56 ratings) |
| In-Person Training | - (0 ratings) | 9.4 (4 ratings) |
| Online Training | - (0 ratings) | 8.0 (4 ratings) |
| Implementation Rating | 9.3 (4 ratings) | 8.0 (34 ratings) |
| Configurability | 10.0 (1 ratings) | 8.1 (2 ratings) |
| Ease of integration | - (0 ratings) | 10.0 (1 ratings) |
| Product Scalability | 8.2 (3 ratings) | 7.0 (3 ratings) |
| Vendor post-sale | - (0 ratings) | 10.0 (1 ratings) |
| Vendor pre-sale | - (0 ratings) | 10.0 (1 ratings) |
| Posit | Tableau Desktop | |
|---|---|---|
| Likelihood to Recommend | Posit (formerly RStudio)
| Tableau
|
| Pros | Posit (formerly RStudio)
Chris Beeley Senior Analyst | Tableau
 Afia Tamanna Information Technology Business Consultant |
| Cons | Posit (formerly RStudio)
 B. Mark Ewing Digital Corporate Technology Manager – R&D | Tableau
|
| Likelihood to Renew | Posit (formerly RStudio)
| Tableau
|
| Usability | Posit (formerly RStudio)
| Tableau
 Al Mubassir Muin Software Engineer |
| Reliability and Availability | Posit (formerly RStudio)
 Kenton Woods Graduate Research Assistant | Tableau
 Brad Llewellyn Associate Data Analytics Consultant |
| Performance | Posit (formerly RStudio) No answers on this topic | Tableau
|
| Support Rating | Posit (formerly RStudio)
 Xiaotong Song Business Analyst | Tableau
|
| In-Person Training | Posit (formerly RStudio) No answers on this topic | Tableau
 Jon Boeckenstedt Associate Vice President |
| Online Training | Posit (formerly RStudio) No answers on this topic | Tableau
 Chandra Bhanu Pratap Singh BI Developer |
| Implementation Rating | Posit (formerly RStudio)
| Tableau
 David Fickes Decision Sciences - Modeling, Simulation & Analysis |
| Alternatives Considered | Posit (formerly RStudio)
| Tableau
|
| Scalability | Posit (formerly RStudio)
Chris Beeley Senior Analyst | Tableau
|
| Return on Investment | Posit (formerly RStudio)
 Flavio Leccese Group Data Scientist | Tableau
|
| ScreenShots | Posit Screenshots  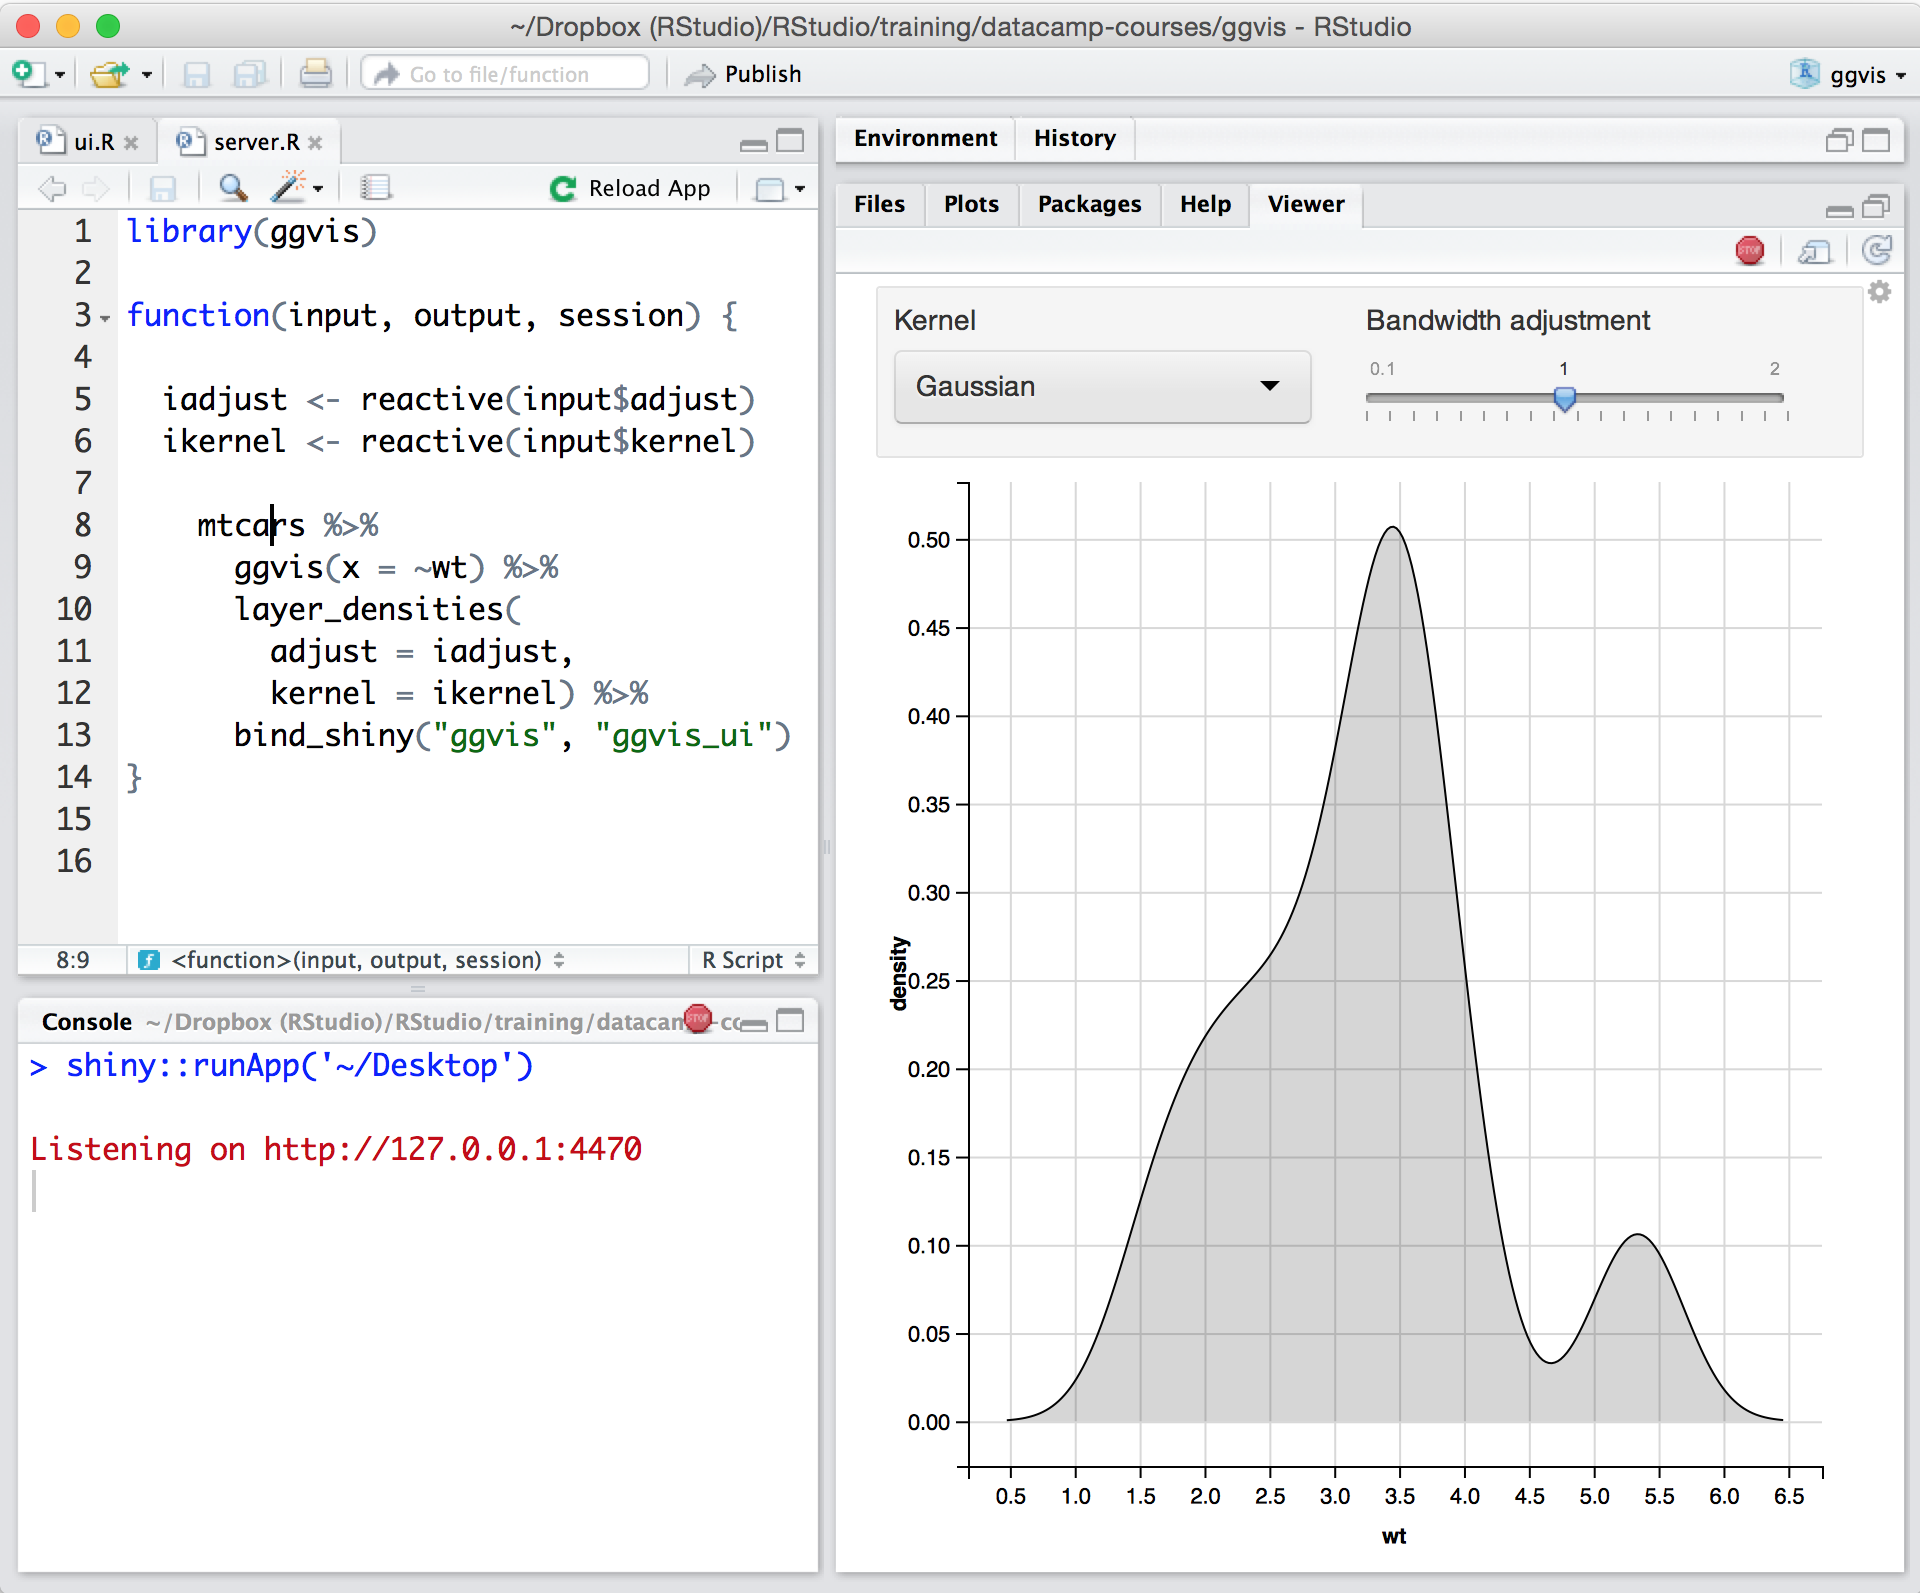    |