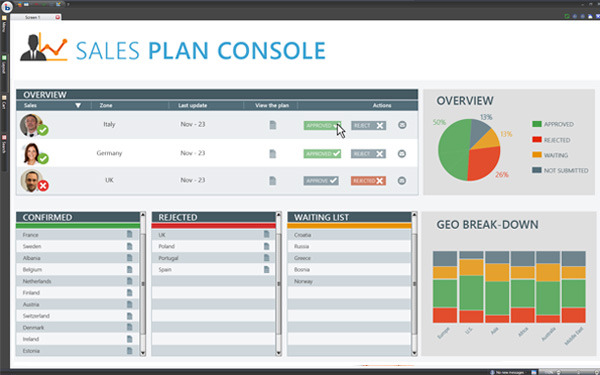
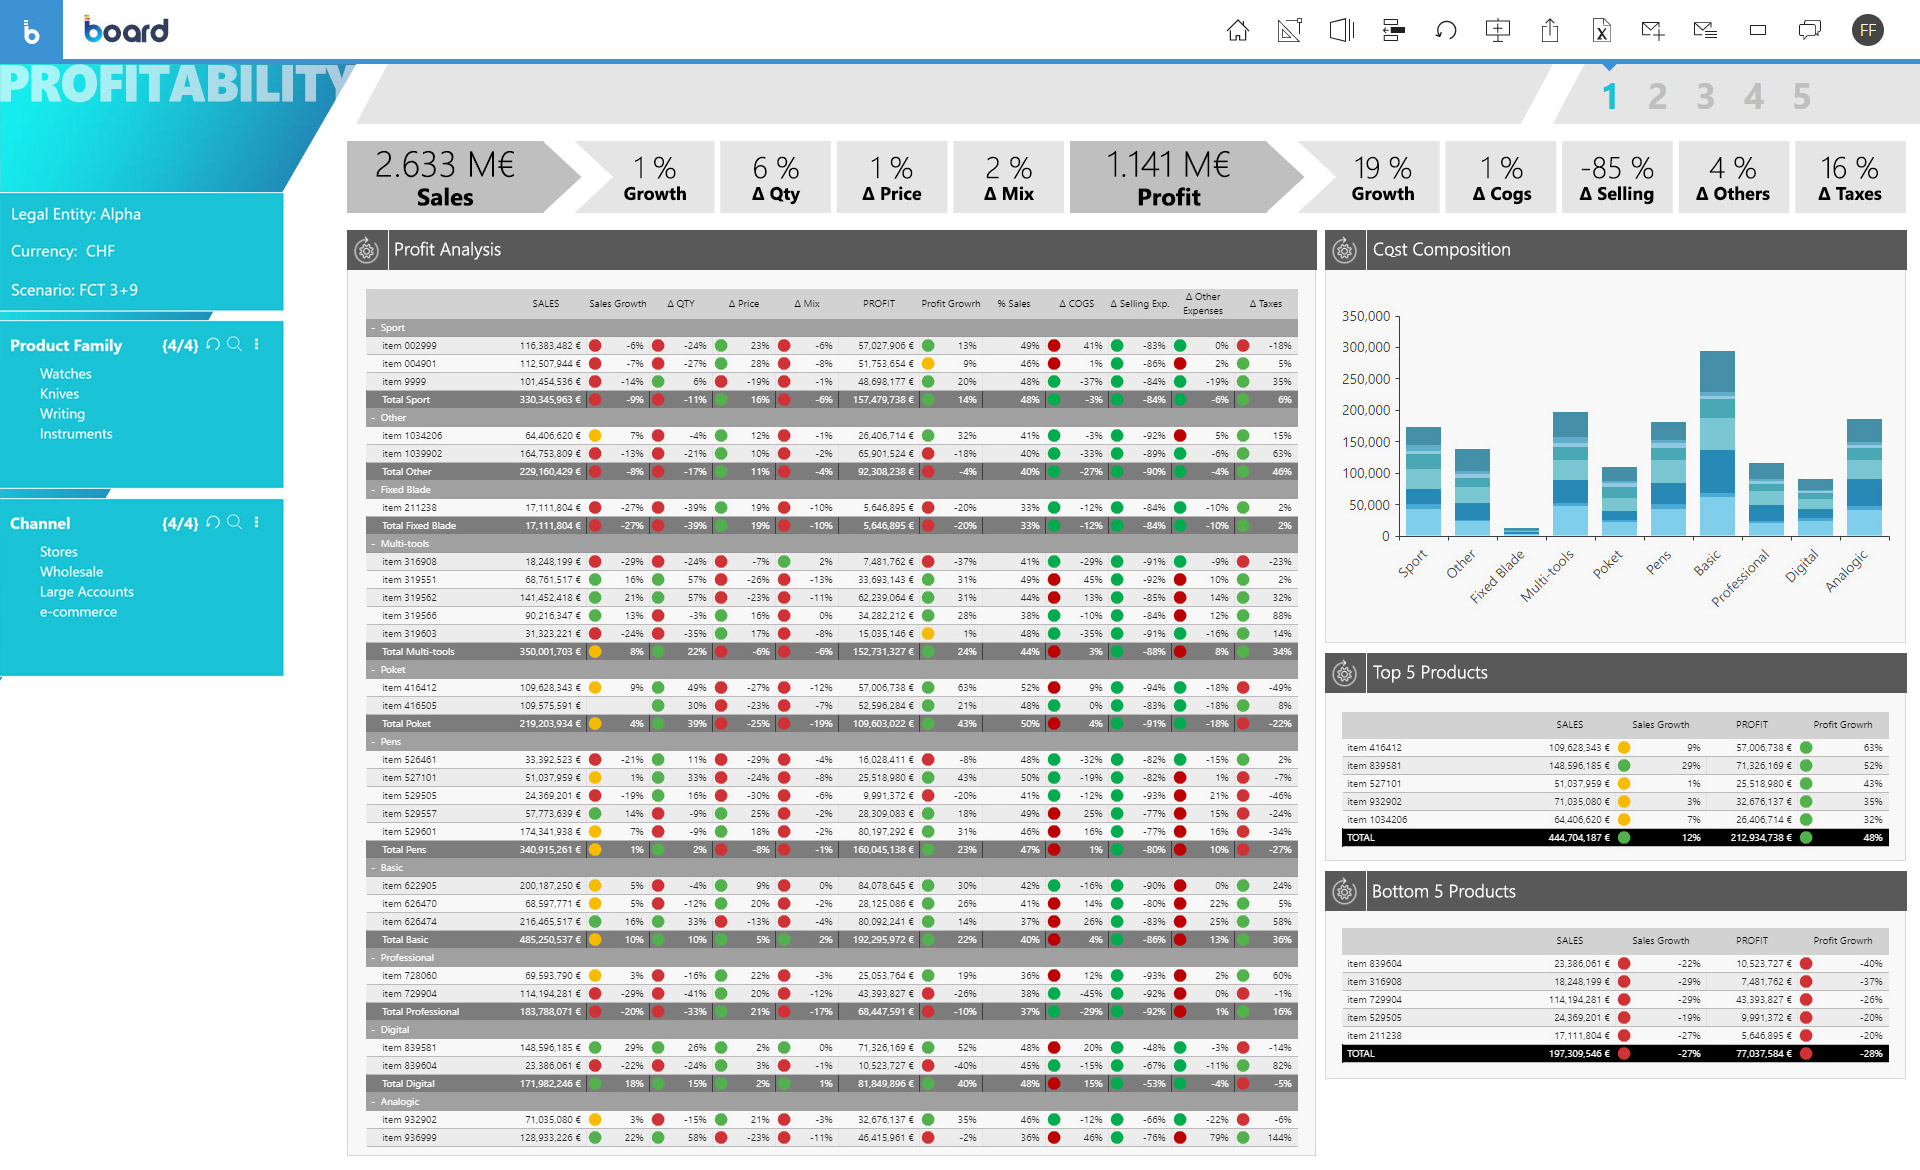
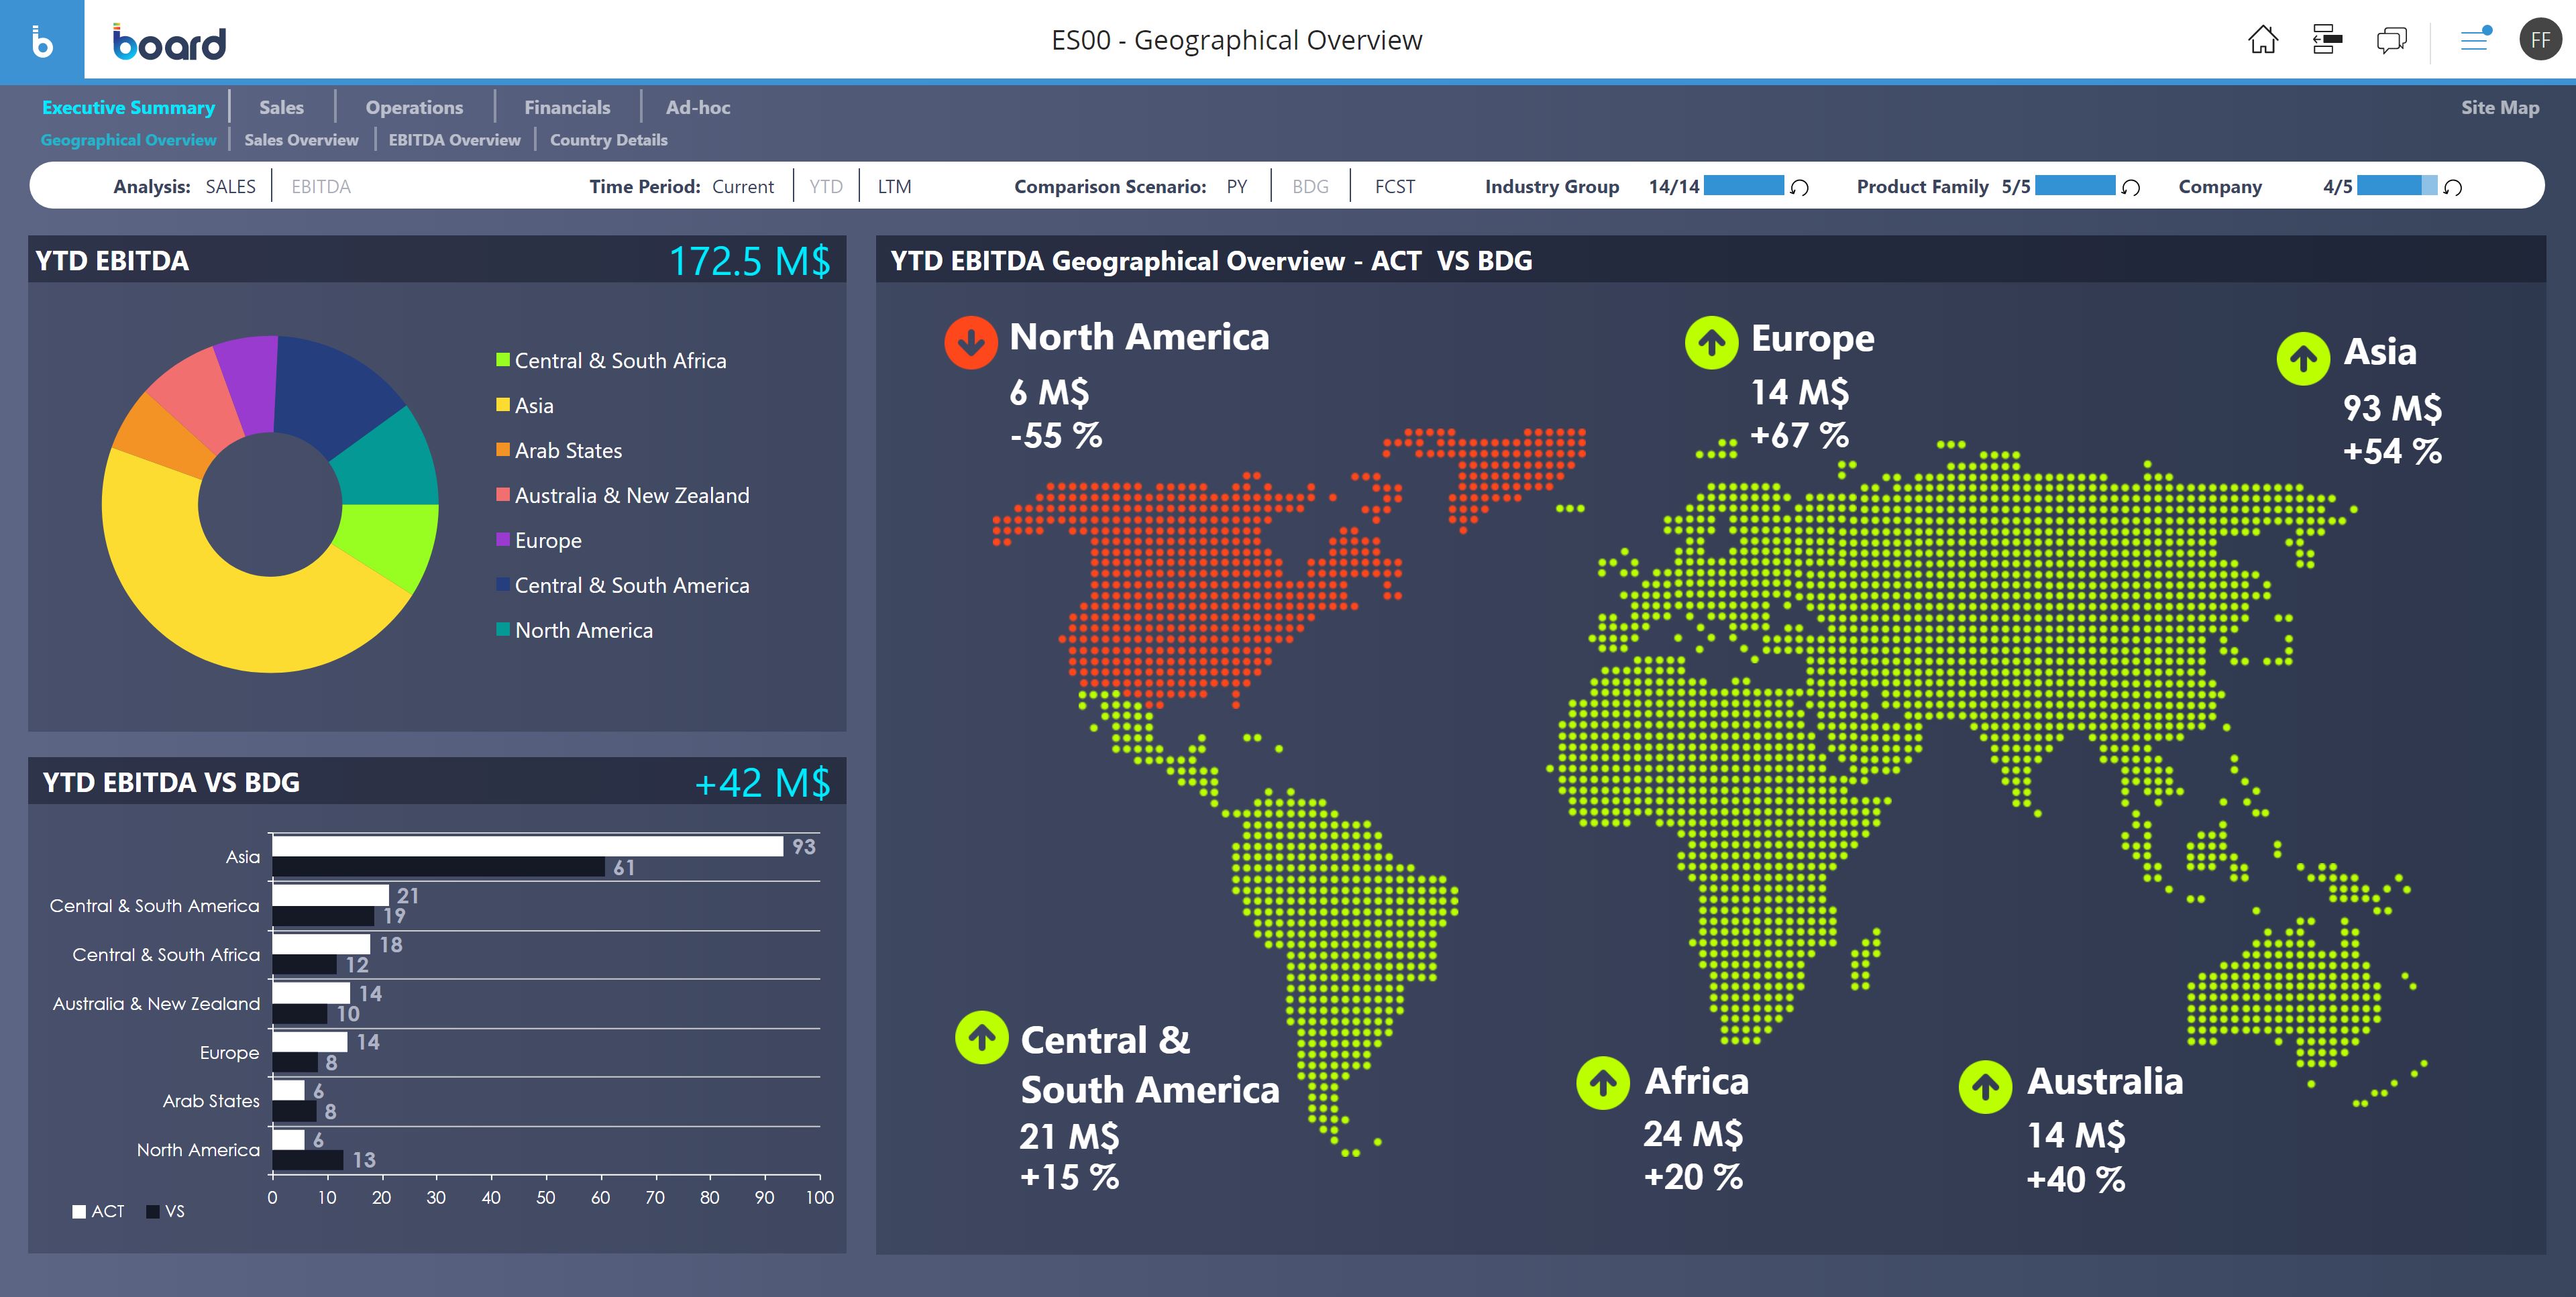
BOARD is a business decision-making platform for organizations of any size. BOARD hosts several business modeling, planning, and analysis all in one cloud-based platform.
N/A
Jirav
Score 7.2 out of 10
Mid-Size Companies (51-1,000 employees)
Jirav, headquartered in San Francisco, aims to deliver smarter financials and faster insights, helping to understand where a business has been and predict where it will go. The system joins cloud-based Accounting, HR, CRM and billing data to automatically surface an interconnected model that is unique to a business. The solution helps eradicate spreadsheet errors, produce monthly reports that occur in real-time, and connected data enables teams to collaborate on multiple scenarios – bookings,…
Board is a useful tool with a great set of features. We migrated from human apps to board and we find it relatively fast in search results and better-managed threads and forums. There are some areas, such as UI and interactions which could be improved but overall a great product. The learning section is also pretty good.
I feel that Jirav would be best suited for companies with less than 75 employees that need a more robust software than Fathom (Quickbooks Onlne integrated FP&A tool based in Australia) that is very customizable, with simple revenue modeling, few personnel changes every month, few departments, no multi currency, and need collaboration only with top-level personnel. I think Jirav is a product that is being highly recommended in the accounting industry for outsourced accounting firms, but accounting only looks at historical information and there needs to more finance industry influence, approval, and input so they can improve their product.
Jirav integrates well with Quickbooks Online (QBO), and I like how you can easily customize the reporting presentation by combining GL accounts and showing more or less details as needed for managerial reporting
I like that Jirav is browser-based and that I can easily share reports with internal and external parties for comments
I feel more confident using Jirav than I do with Excel because there is more data validation, and some notifications will appear if there are errors in the model
The sales capacity model and ramping employees schedule that their implementation / professional services team built for us works well overall (with some limitations)
Ideally, having a direct integration into Jirav would be great for all our data. However, some of our software didn't have a direct integration, so I was glad that Jirav offered the ability to use a connected Google Sheet that lets me input data that can be imported directly into the system
At times, I feel that Jirav is too customizable. It would be great if they could tailor the system to be more industry-specific. For example, if the system could provide standard formulas for SaaS industry metrics already within the system, then that would have saved me a ton of time with having to create the metrics myself. The formula creation for metrics is quite tedious as well because you can only do simple calculations, such as A + B or A x C. You cannot do A + B + C or A x B x C.
I struggle with the way they have their staff planning set up because I have to reimport an Excel every month with all the changes (new hires, terminations, pay changes), and the changes appear to be retroactive on reports, which doesn't make sense if someone receives a raise or pay change during the year. It would be much easier for planning for bookings if they could add a column for quota by salesperson.
If there are notifications of errors in the model, then the notifications will continue to present themselves after I resolve the issue. It would be nice if I could clear out notifications I know are not relevant anymore. I also still find errors in the system that I would have expected the system to notify me about, such as Assumptions that are set up but they are not included in any formulas, so I should delete that assumption to prevent anyone from thinking changing that assumption will impact the model.
There is some functionality for sharing reports and information, but there is not enough granularity in security settings to allow me to share certain information easily. For example, if I want to share information with managers to manage their departments' budget, but also not see their boss' compensation, then it takes some work to set that up. Or, if I want to share a report with a recruiter of planned headcount and salary, then I need to export it to Excel first and delete Actual headcount and salary, so they don't see current employees' compensation (including the person's boss' salary).
Customer and vendor names do not import, only the totals, so if you look at Actuals vs Plan, the actuals will show a total figure and the plan will show detail, creating the need for an external and manual reconciliation
There is no multi-currency available
Scenario analysis can be difficult to do quickly. For example, if I want to see the plan with planned hires and without planned hires, then I would need to create two separate plans, individually select and delete the planned hires in one plan and keep then in another plan, which is time-consuming
Using Google Sign-In causes the system to time-out frequently for me, so I get kicked out of the system and have to log back in. If I have multiple tabs of Jirav open, then re-logging in sometimes doesn't bring me back to where I was originally at.
You can export reports to Excel, but there are no formulas of the calculations, which makes it more difficult to understand how calculations are being performed unless you look in the browser and dig into the calculations. This also might make it more difficult if you decide to go to another software in the future since you may need to start from scratch in the next software
Seasonality has been difficult to model. For example, the way our model is set up, I can use an assumption for Q1, Q2, Q3 and Q4. However, if I update Q3 for this year, then it also updates Q3 of all subsequent years, which I don't want. A more complex model and additional maintenance would be needed to accomplish more accurate seasonality planning
Board is a fantastic product for swift BI solution delivery when compared with its peers. Ease of use, support and integration with Microsoft Office Addin open a wide horizon of opportunities for further enhancements to solutions. Easy bespoke app development capabilities make it a winner for us. BOARD is just like a white canvas, it lets you explore your creative side while designing and delivering a solution
From a user perspective, Board is quite simple to use. You can evaluate the presentation of the data, the navigation, the configuration of the users, the selection of the data etc ... It would have a better rating if it were even more intuitive as regards the construction of a project, starting from the database, to the info-cubes, to entities, to data acquisition procedures from other servers.
The only time I needed assistance was due to a problem in the prints: the colors of the brochures as they were on the screen were not reproduced in the print, but a series of standard colors were reproduced. This fact made colored numbers on a colored background illegible. From the assistance they confirmed that it was a problem of version 10.2 that occurred when leaving the brochures with the default colors proposed by Board. To obtain the desired colors, they had to be personalized ... I didn't like the solution very much and the technician who recommended it didn't like me either, but they would have solved the problem with the following versions. In any case, the assistance was quick and effective even if not exactly efficient.
Board is fairly simple and straight forward. Advance training on workflows and procedures is a good one but the training content only touches through the interesting areas. training content needs to cover a few areas more in-depth
The problem of user profiling in our context is certainly quite complex. The complexity is given by the fact that the company is divided territorially into logistic points of sale, but at the same time they are virtually divided into divisions (or specific implementation areas) and points of sale of competence. The same operator can have access to data at different logistic sales points, sales points of competence and divisions.
Board has been more complete when compared to Anaplan. Although I didn't participate in the buying decision of any of those products I have used both and by far Board just has more features. It's more than a CPM, it's BI and CPM put together. If I had to make a choice now it would be Board.
Fathom was the cheapest and most basic as an add-on directly to QuickBooks Online Plus, but you lose functionality with Fathom if you use QuickBooks Online Advanced (QBOA). The main loss of functionality for me was the lack of multiple department reporting, which was absolutely necessary for my analysis. Jirav was half the price of Moscaic.tech, but I've heard Mosaic has standard metrics for the SaaS-industry, which is appealing after going through the tedious process of setting up metrics in Jirav. QBOA has additional reporting than QBO Plus, but not enough robust features for planning and modeling. PlaceCPM is Salesforce-based and a I felt having a strong Salesforce admin that can great reports made their unnecessary, and I feel like most of the time you need a Salesforce admin just to run Salesforce. Cube, Vena and OnPlan are spreadsheet-based, but I don't want to use spreadsheets. Prophix, Board and Anaplan seem outdated. Workday was more than what I needed
Board facilitates proactive decision making - it gives all the insights of the company's needs, which includes predictive analytics and manipulation of data to make different types of reports.
Easy to use for non-programmer and integration with other software is seamless. It has [the] ability to handle large amounts of data.