Chartbeat delivers real-time analytics, insights, and transformative tools for content teams around the world, to help improve audience engagement, inform editorial decisions, and increase loyalty.
N/A
Comscore Ad Metrix
Score 8.0 out of 10
N/A
Comscore offers marketing intelligence platform Ad Metrix to complement their digital marketing analytics offerings.
N/A
Pricing
Chartbeat
Comscore Ad Metrix
Editions & Modules
No answers on this topic
No answers on this topic
Offerings
Pricing Offerings
Chartbeat
Comscore Ad Metrix
Free Trial
Yes
No
Free/Freemium Version
Yes
No
Premium Consulting/Integration Services
No
No
Entry-level Setup Fee
No setup fee
No setup fee
Additional Details
Chartbeat pricing is based on monthly site page views. Discounts are applied to multi-year contracts. The Basic Plan includes the Real-time Dashboard, Historical Dashboard, Heads Up Display, Reports, Big Board, iOS and Android app, and Real-time API endpoints.
The Plus Plan includes all of the Basic Plan features, plus ONE of the following Premium features: Headline Testing, Advanced Queries, or Multi-Site View.
The Premium Plan includes all of the Basic Plan features, plus ALL Premium features: Headline Testing, Advanced Queries, Multi-Site View, and enterprise-level support and custom trainings.
The main point of benefit is the realtime data. This is vital to our team as we are publishing a lot of content per day, so we have a busy homepage to manage and it's important to know which content is performing well. We also like to get an understanding as quickly as possible - which Chartbeat offers - of where traffic is coming from. Often we will see an example where a page is getting high traffic from Google, for example, and we know that might not need to be placed so prominently on the homepage because the traffic is arriving to us externally anyway. Without that depth of understanding what is performing best and why - updated immediately, unlike in Google Analytics now - our homepage would not be as well optimised for users coming to us direct
Ad Metrix is well suited for teams that are directly tied to sales teams as well as teams that use DMP and other platforms to help target and retarget specific users for ads or site visits/views.
It may not be as useful if the organization is not targeting specific users or isn't interested in their consumption habits and what competitors are focusing on.
Site Analytics data - ComScore puts all of the stats you need in an easy to read dashboard. I don't need to search around like I do in Google Analytics to find out who is visiting my client's site, where they are browsing, how long they are engaging with the content. It's also really easy to integrate conversion data alongside website analytics. The webpage heat maps are also an awesome way to look at where people are engaging with the client's webpages.
Infographics, charts - I love how easy it is to pull a client ready chart that I can insert into a presentation for the client to show various stats pertaining to their campaigns (e.g. most visited pages, most viewed videos, MoM stats on orders/revenue/average order value.
Report Builder - Makes it simple to pull reports on site analytics that I can easily add filters to. I can get all the data I need in one report. I do a lot of presentation building for the clients on a monthly basis. This makes it more efficient for me to pull out sharable insights.
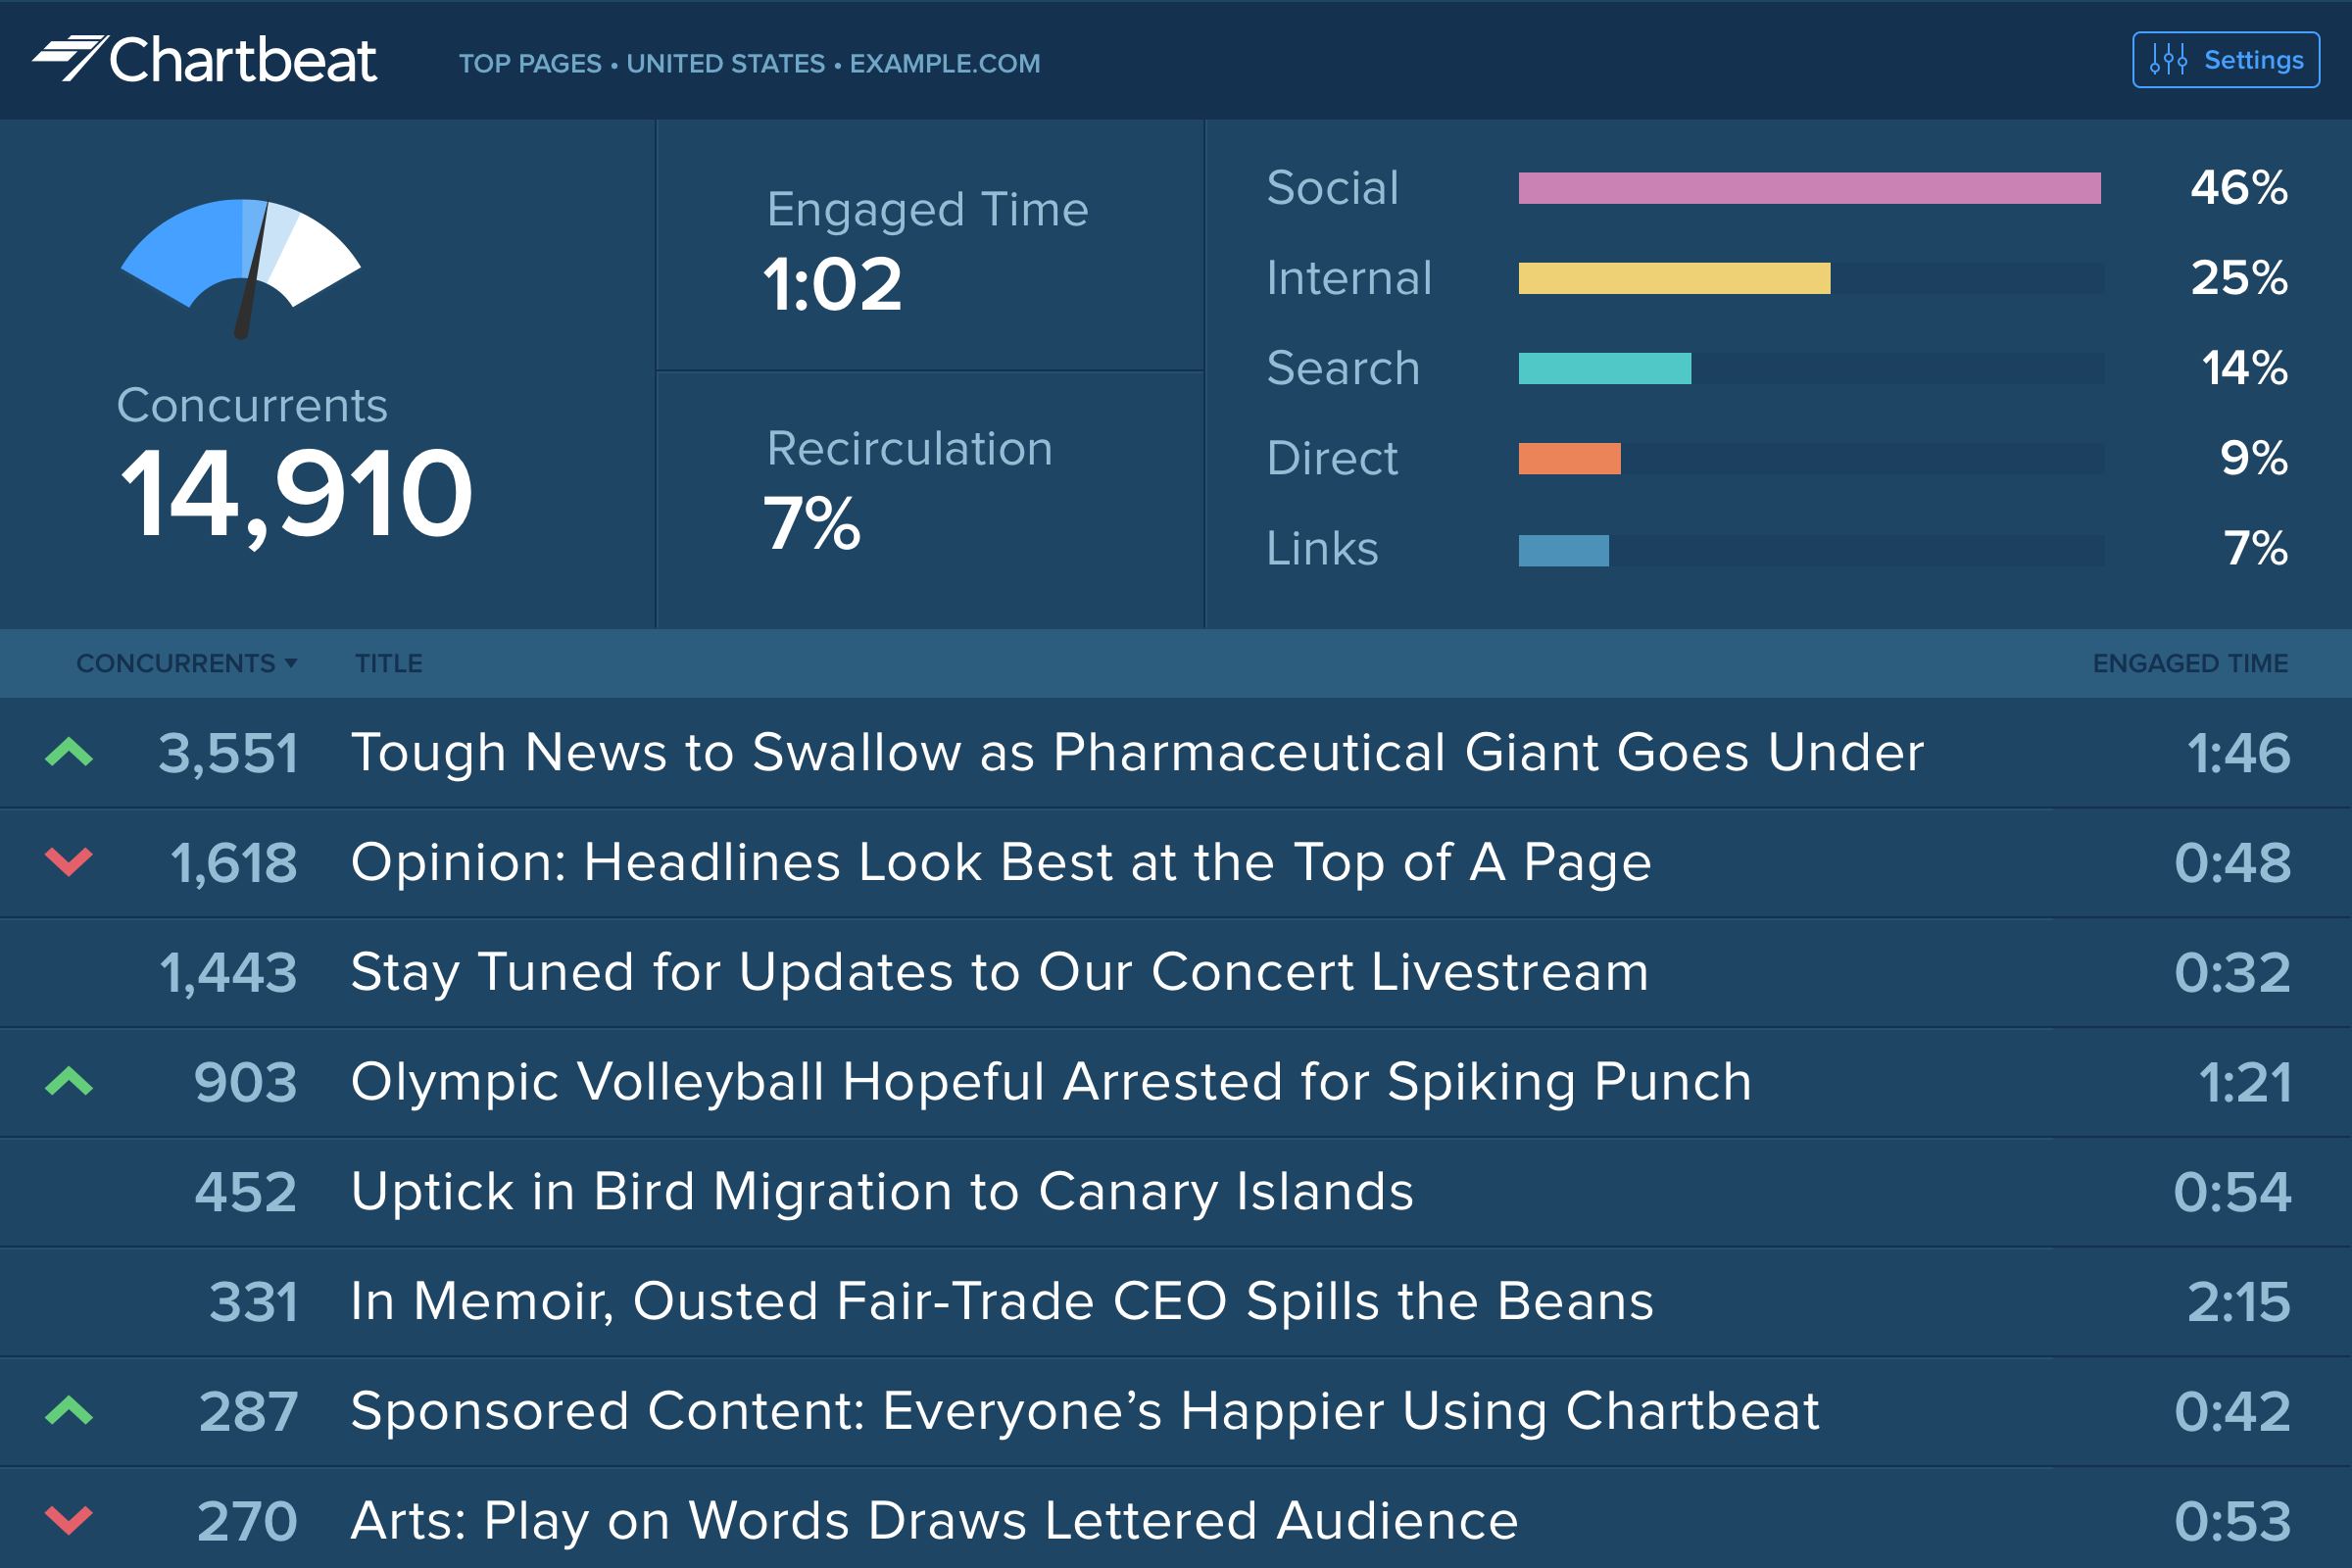
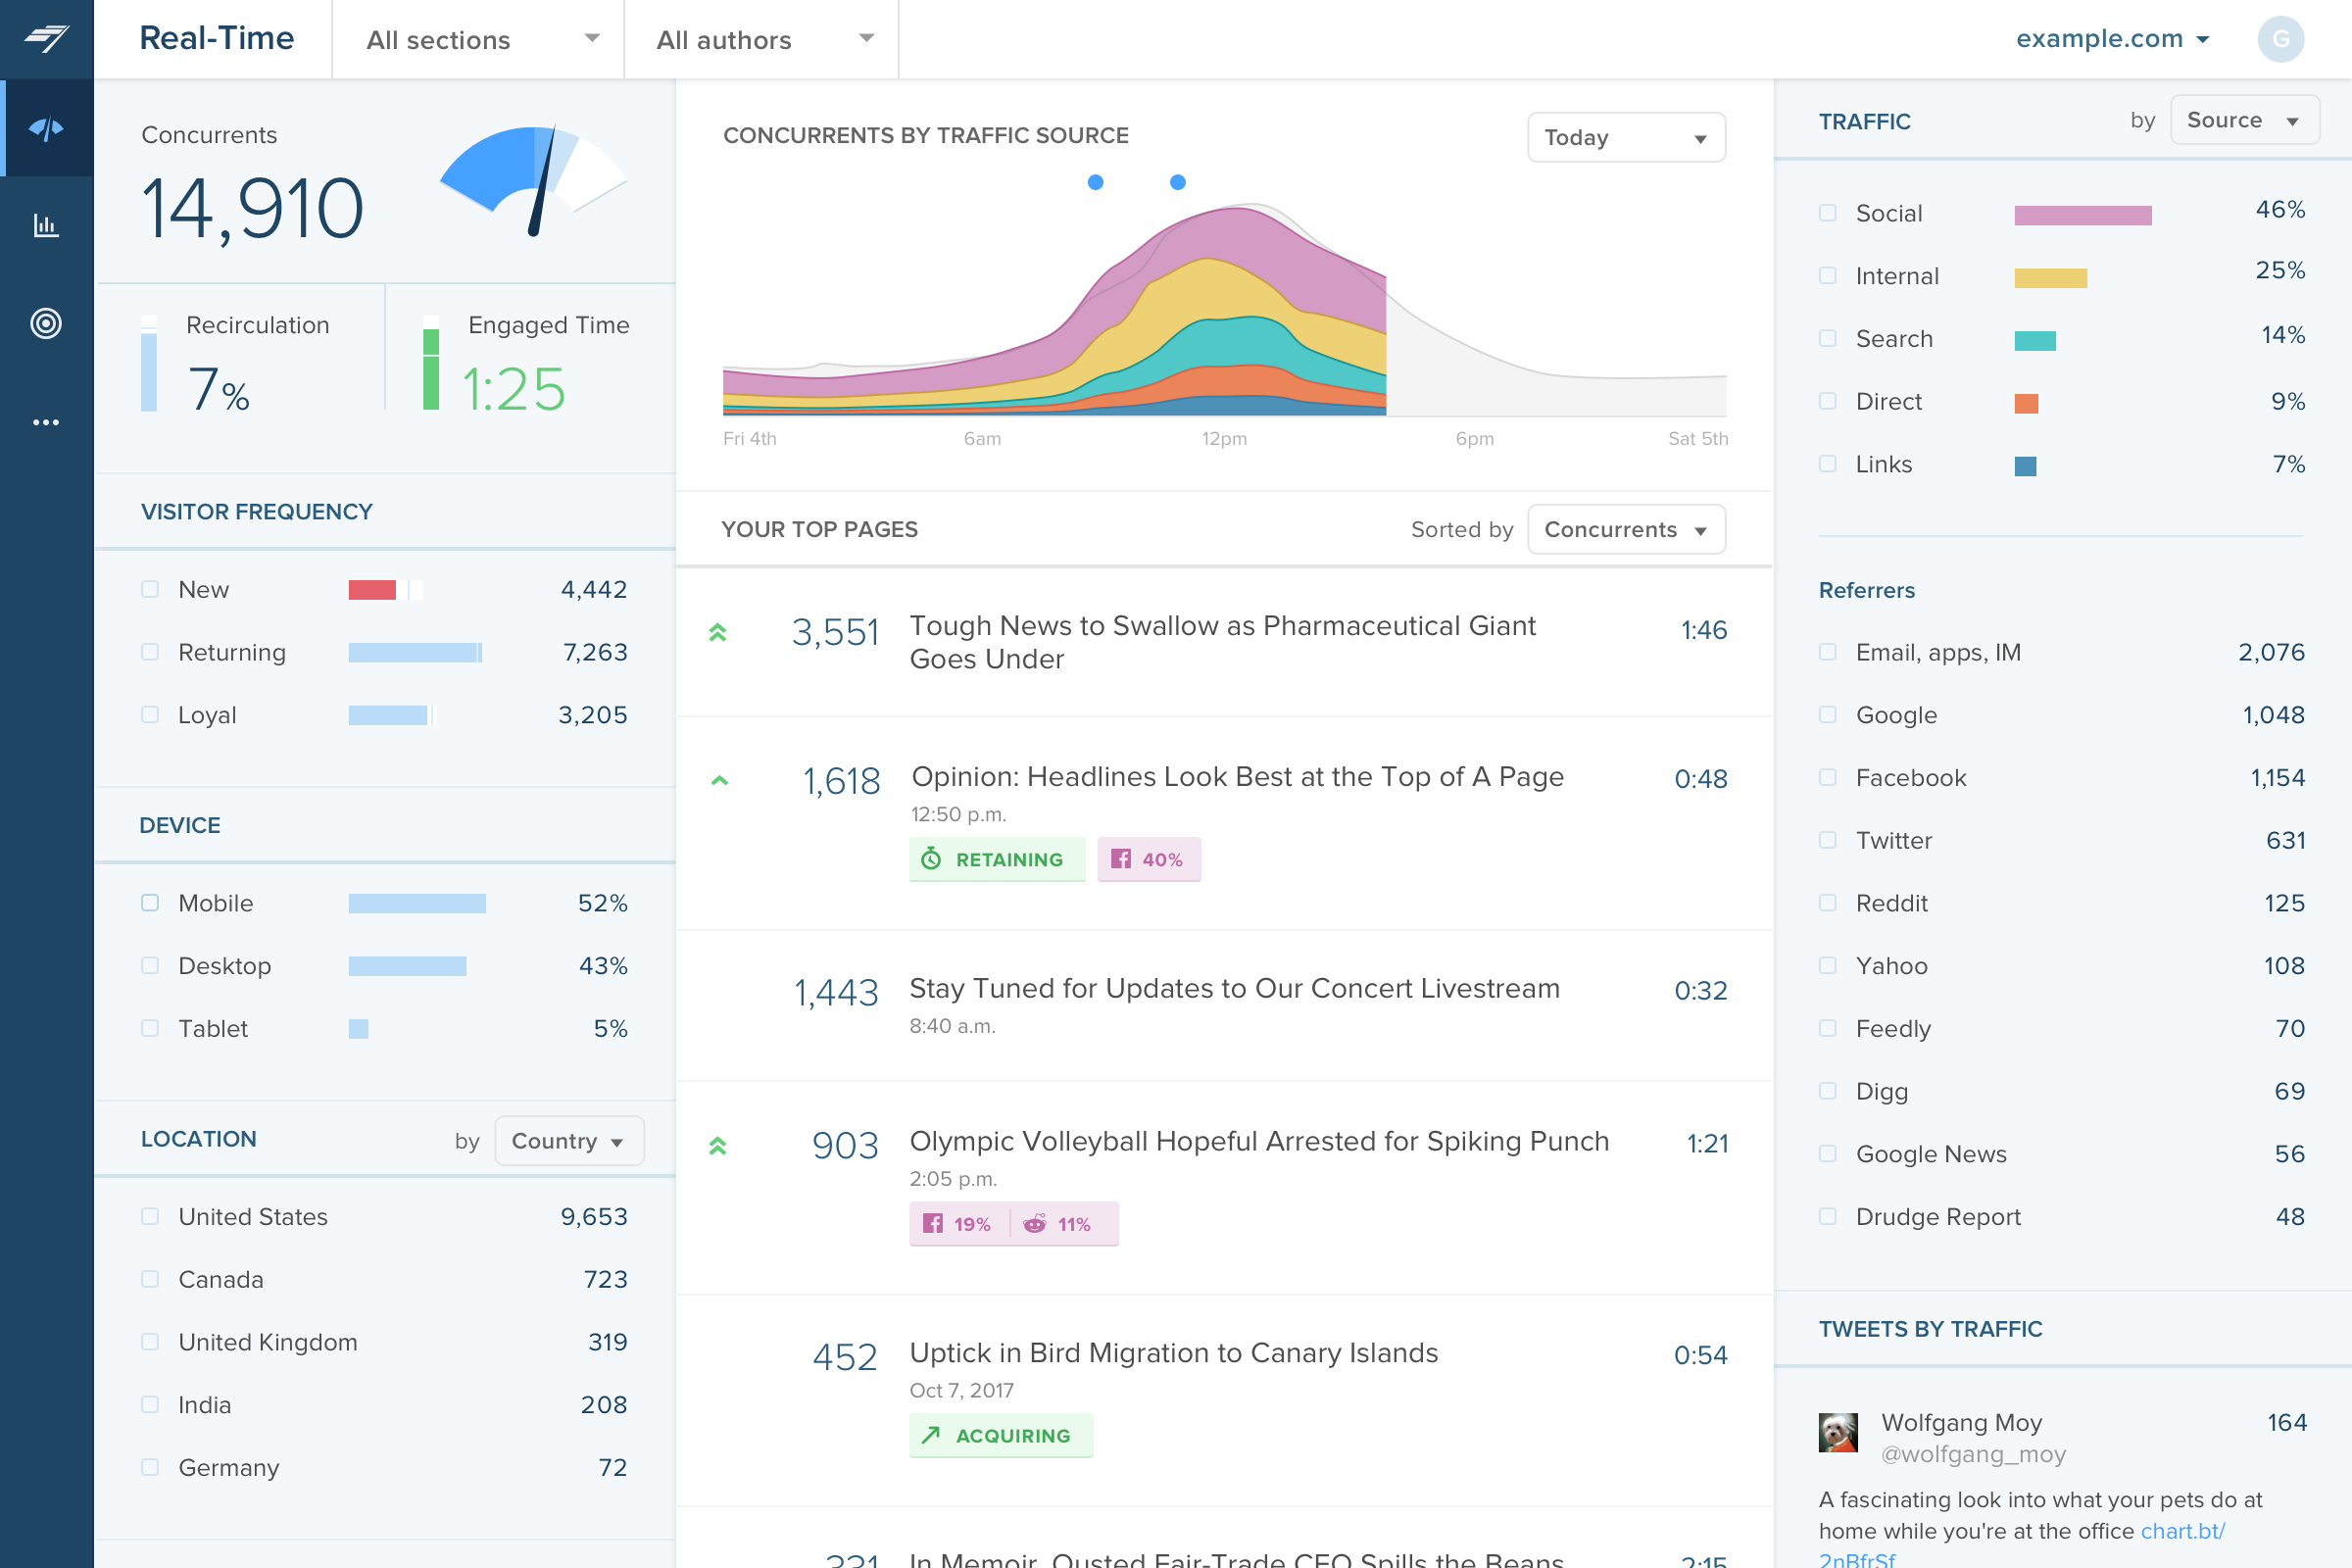
Source of traffic needs improvement. Search and social make sense, but "internal" and "links" is a grey area. It would be helpful to define those with an organization and provide an information icon so users can easily remember what each of those buckets is tracking.
More ways to customize the real-time board. For example, with video content, that's great that I can see a user has started a video, but what is the completion rate, was that only on O&O or can that track Facebook, too?
Would like to see demo (age) information included as a way to slice the data so I can see what's working with my older and younger demo.
I gave Chartbeat a 5 for a renewal rating, because, while it delivers clear and understandable content, Google Analytics also provides many of the same features for free. For a small to medium website, I believe it would be more cost effective to use Google Analytics. A website with a high amount of traffic, however, could merit spending the money on Chartbeat to maximize their potential.
I am able to "set it and forget it," keeping it up on my monitor for either constant checking or just keeping an eye on the numbers during the day. I'm also able to keep track of what times are perfect to post a story and which stories rack up the most traffic.
I have had limited experience of support for Chartbeat but whenever I have needed help it has been there. Recently there was an issue of seeing different forms of data in real time - app and otherwise effectively, and the issue was being clearly dealt with and communicated back to us.
The staff is available pretty quickly for questions, but are not really around in-person to meet with me and my team. They are able to solve my problems online and do work sessions as needed via skype.
Omnilytics is more robust, detailed, and catered for an intermediate media user, while I think Chartbeat is a more user-friendly and beginner-oriented piece of technology. That being said, there is an impressive amount of lift for Chartbeat, and it's evident that simplicity is the key to using a software daily (which is absolutely the point in the content world).
They're both fairly similar in relaying data for us on our viewers. We've used comScore longer and are able to compare specific data to one another as well as competitor sites
I have not used the tool long enough to determine myself, but my understanding is the team has been able to drive growth and sales significantly through the use of the tool.