Datadog is a monitoring service for IT, Dev and Ops teams who write and run applications at scale, and want to turn the massive amounts of data produced by their apps, tools and services into actionable insight.
$18
per month per host
Lansweeper
Score 8.7 out of 10
N/A
Lansweeper helps organizations see, understand, and make confident decisions about their technology estate across IT, OT, IoT, and Cloud. Lansweeper automatically discovers and inventories every asset: hardware, software, and user—then connects that data to insights about usage, lifecycle, and risk. This is to create what the vendor describes as Technology Asset Intelligence (TAI): a trusted foundation of knowledge that turns raw inventory data into clear, actionable…
$2,868
per year (includes 2000 assets)
Pricing
Datadog
Lansweeper
Editions & Modules
Log Management
$1.27
per month (billed annually) per host
Infrastructure
$15.00
per month (billed annually) per host
Standard
$18
per month per host
Enterprise
$27
per month per host
DevSecOps Pro
$27
per month per host
APM
$31.00
per month (billed annually) per host
DevSecOps Enterprise
$41
per month per host
Starter
$239
per month (billed annually) Includes 2,000 assets
Pro
$439
per month (billed annually) Includes 2,000 assets
Enterprise
Contact Sales
Starts at 10,000 Assets
Offerings
Pricing Offerings
Datadog
Lansweeper
Free Trial
Yes
Yes
Free/Freemium Version
Yes
No
Premium Consulting/Integration Services
No
Yes
Entry-level Setup Fee
Optional
No setup fee
Additional Details
Discount available for annual pricing. Multi-Year/Volume discounts available (500+ hosts/mo).
Datadog may be better suited for teams that have a more out-of-the-box infrastructure, on the primary platforms Datadog supports. You may also have better results if you have a bigger team dedicated to devops and/or a bigger budget. We found that trying to adapt it to our use case (small team, .NET on AWS Fargate) wasn't feasible. We continually ran into roadblocks that required us to dig through documentation (and at times, having to figure out some documentation was wrong), go back and forth with support, and in my opinion, waste money on excessive and unintended usages due to opaque pricing models and inaccurate usage reports, as well as broken/non-functional rate sampling controls.
Lansweeper I believe is well suited for any environment - its low cost and small footprint make it an easy addition to any organization, big or small, that is looking for an asset inventory solution that can either replace or supplement existing asset management systems. It may not be well suited for situations where a lot of customization is necessary, such as pulling in custom fields or details from equipment that don't reside in a registry.
The thing which Datadog does really well, one of them are its broad range of services integrations and features which makes it one step observability solution for all. We can monitor all types of our application, infrastructure, hosts, databases etc with Datadog.
Its custom dashboard feature which helps us to visualize the data in a better way . It supports different types of charts through those charts we can create our dashboard more attractive.
Its AI powered alerting capability though that we can easily identify the root cause and also it has a low noise alerting capability which means it correlated the similar type of issues.
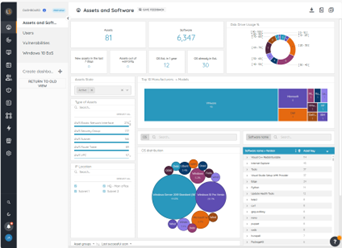
Inventory - LANSweeper scans the network for devices - anything with an SNMP trap or using AD or local credentials. We can get an in-depth look at devices.
Reporting - LANSweeper can generate just about any report you can imagine. We can check RAM in groups and determine where upgrades are needed. We can find local printers (which aren't allowed on our network) and address that issue with the user. We can check CPU type to help determine end of life without our network.
Printers - It's nice to have a quick look at printer statuses. Toner levels, out of paper, and service errors are all reported via LANSweeper.
Alert windows cause lag in notifications (e.g. if the alert window is X errors in 1 hour, we won't get alerted until the end of the 1 hour range)
I would appreciate more supportive examples for how to filter and view metrics in the explorer
I would like a more clear interface for metrics that are missing in a time frame, rather than only showing tags/etc. for metrics that were collected within the currently viewed time frame
Can only scan what it sees. Doesn't show every item on the machine. Patches are also absent.
Software Recognition is OK with Microsoft. It is dire within our network of multiple products. Recognition is at about 35% with constant manual work needed to baseline for each manufacturer in each network
Datacenter compliance is a manual project. We used Excel extensively.
License optimization is limited to installations v surplus licenses. We need to know who's using what and how.
There are so many features that it can be hard to figure out where you need to go for your own use case. For example, RUM monitoring us buried in a "Digital Experience" sidebar setting when this is one of our key use cases that I sometimes struggle to find in the application. It appears that ECS + Fargate monitoring was recently released which is great because we had to build a lambda reporting solution for ephemeral task monitoring. But this new feature was never on my radar until I starting clicking around the application.
The tool is a web gui, and is mostly easy to navigate, but certain areas are more unclear than others. Identifying what im filtering for, or what menu option has what impact can be less straightforward than I'd like. Overall though, this tool will provide me with information other tools in my box just don't.
The support team usually gets it right. We did have a rather complicate issue setting up monitoring on a domain controller. However, they are usually responsive and helpful over chat. The downside would be I don’t think they have any phone support. If that is important to you this might not be a good fit.
Lots of info online there are tons of SQL Reports you can copy from the web as Lansweeper and users post many of them. They also send out alerts that pop up on Lansweeper, letting you know of an update that you need for certain software and provide an SQL report so you can scan your system to see what PCs need this update.
Our logs are very important, and Datadog manages them exceptionally well. We frequently use Datadog services for our investigations. Use case: Monitor your apps, infrastructure, APIs, and user experience.
Key features:
Logs, metrics, and APM (Application Performance Monitoring)
Real-time alerting and dashboards
Supports Kubernetes, AWS, GCP, and other integrations
RUM (Real User Monitoring) and Synthetics
✅ Best for backend, server, and distributed systems monitoring.
In short it has more features and its a more robust solution and it works well with those solutions. I am sure it will keep track with Ai and action recommendations in the future as I didnt see any of it on the platform (at least the one we use) I thin that is the only thing that is missing in the current product
It had a positive impact on solutions expense cause several teams we're using different solutions with different costs that used several servers and DB resources. Now, we've been able to simply that a lot with Lansweeper.
With my previous point, people had to train and learn about each of their solutions. Now we can put a team in charge and so the other teams can focus on other tasks.
Last year Lansweeper changed their licencing prices a lot so it slashed our budget.