Piwik is an open source analytics platform that enables users to measure web and mobile apps as well as intranet portals. It protects the privacy of users through advanced privacy features and its approach to data ownership. Piwik offers On-premises and Cloud deployment options.
Available in over 50 languages, it is fully customisable and vendor-independent. Piwik offers over 70 integrations with Content Management Systems, Ecommerce solutions, Forums as well as other mobile and web platforms.…
$0
Tableau Desktop
Score 8.4 out of 10
N/A
Tableau Desktop is a data visualization product from Tableau. It connects to a variety of data sources for combining disparate data sources without coding. It provides tools for discovering patterns and insights, data calculations, forecasts, and statistical summaries and visual storytelling.
$1,380
per year (purchased via a Creator license)
Pricing
Matomo Analytics
Tableau Desktop
Editions & Modules
Free download (open source)
$0
Free 30 day trial
$0
limited to 30 days
Essential
$9
number of pageviews (monthly traffic)
Business
$29
number of pageviews (monthly traffic)
Enterprise
$199
your requirements and monthly traffic
Content Optimization Bundle
$579
per installation
Growth Bundle
$1,149
per installation
Premium Bundle
$1,499
per installation
Email Support Subscription
$2,090
per installation
Tableau Creator License
$115
per month (billed annually) per user
Offerings
Pricing Offerings
Matomo Analytics
Tableau Desktop
Free Trial
Yes
No
Free/Freemium Version
Yes
Yes
Premium Consulting/Integration Services
Yes
Yes
Entry-level Setup Fee
Optional
No setup fee
Additional Details
On-premise Edition is free to download and install on one's own servers.
All pricing plans are billed annually. A Creator license includes Tableau Desktop, Tableau Prep Builder, and Tableau Pulse. Discounts sometimes available for volume.
More Pricing Information
Community Pulse
Matomo Analytics
Tableau Desktop
Features
Matomo Analytics
Tableau Desktop
Web Analytics
Comparison of Web Analytics features of Product A and Product B
Matomo Analytics
9.8
2 Ratings
19% above category average
Tableau Desktop
-
Ratings
Lead Conversion Tracking
10.02 Ratings
00 Ratings
Bounce Rate Measurement
10.02 Ratings
00 Ratings
Device and Browser Reporting
10.02 Ratings
00 Ratings
Pageview Tracking
10.02 Ratings
00 Ratings
Event Tracking
10.01 Ratings
00 Ratings
Reporting in real-time
8.42 Ratings
00 Ratings
Referral Source Tracking
10.02 Ratings
00 Ratings
Customizable Dashboards
10.02 Ratings
00 Ratings
BI Standard Reporting
Comparison of BI Standard Reporting features of Product A and Product B
Matomo Analytics
-
Ratings
Tableau Desktop
8.4
175 Ratings
2% above category average
Pixel Perfect reports
00 Ratings
8.0145 Ratings
Customizable dashboards
00 Ratings
9.1174 Ratings
Report Formatting Templates
00 Ratings
8.1151 Ratings
Ad-hoc Reporting
Comparison of Ad-hoc Reporting features of Product A and Product B
Matomo Analytics
-
Ratings
Tableau Desktop
8.3
172 Ratings
3% above category average
Drill-down analysis
00 Ratings
8.5167 Ratings
Formatting capabilities
00 Ratings
8.4170 Ratings
Integration with R or other statistical packages
00 Ratings
8.0126 Ratings
Report sharing and collaboration
00 Ratings
8.5165 Ratings
Report Output and Scheduling
Comparison of Report Output and Scheduling features of Product A and Product B
Matomo Analytics
-
Ratings
Tableau Desktop
8.3
166 Ratings
1% above category average
Publish to Web
00 Ratings
8.0155 Ratings
Publish to PDF
00 Ratings
8.0154 Ratings
Report Versioning
00 Ratings
8.3120 Ratings
Report Delivery Scheduling
00 Ratings
8.5128 Ratings
Delivery to Remote Servers
00 Ratings
8.878 Ratings
Data Discovery and Visualization
Comparison of Data Discovery and Visualization features of Product A and Product B
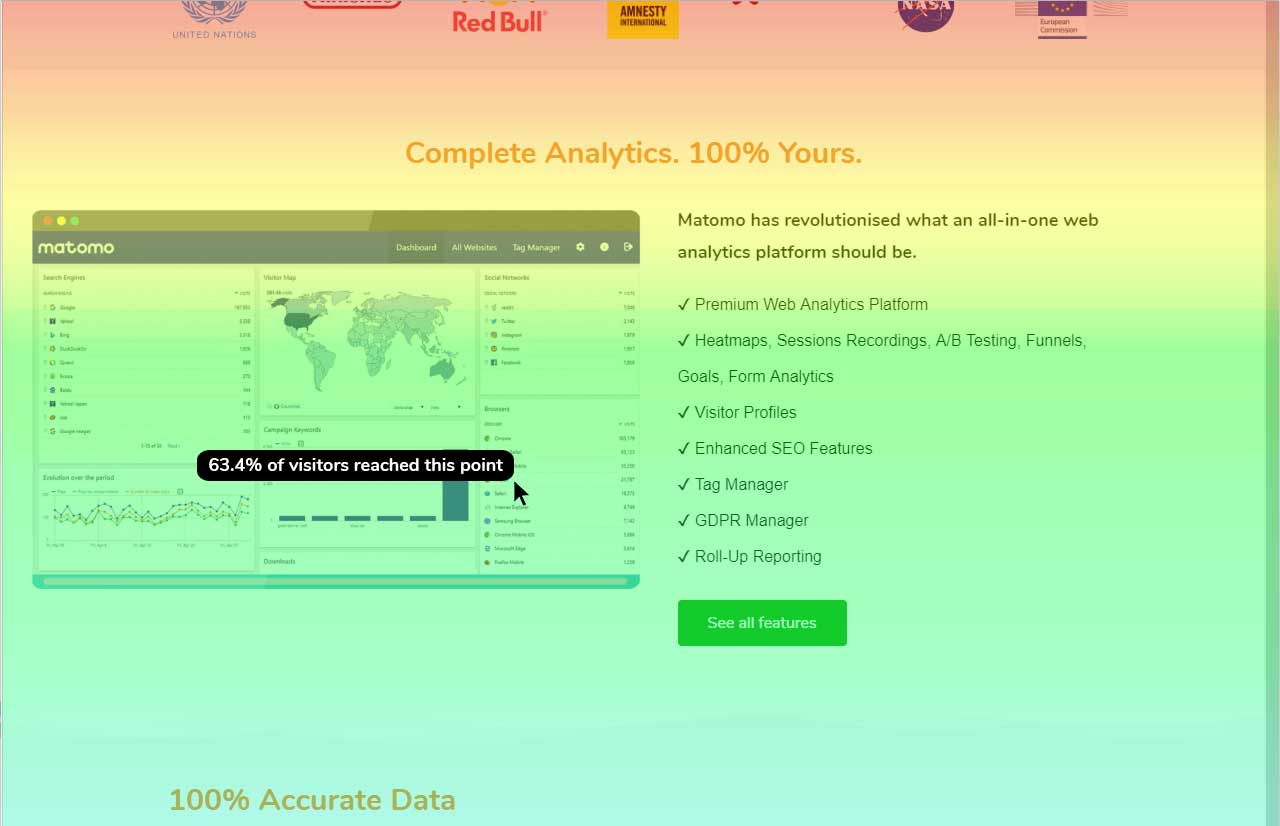
If you want to balance data-driven marketing and a privacy-minded approach to analytics, Matomo Analytics is for you. It's easy to be compliant with GDPR and other regulations while still having detailed (anonymized) analytics that help inform what content is resonating vs what content is not resonating. And of course you also get all of the rich referral, campaign, and goal conversion data to help you optimize your marketing.
The best scenario is definitely to collect data from several sources and create dedicated dashboards for specific recipients. However, I miss the possibility of explaining these reports in more detail. Sometimes, we order a report, and after half a year, we don't remember the meaning of some data (I know it's our fault as an organization, but the tool could force better practices).
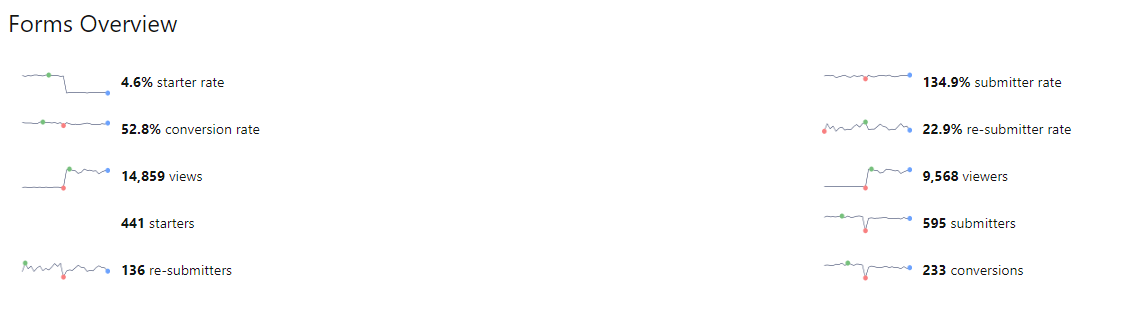
One of Piwik's strengths is the provision of customizable widgets for different bits of analytics data. The ability to add and remove them, change dates and more makes this a flexible way to visualize data.
The visitor log section is also rich, providing date, keywords, actions and more in a single table, which makes it easy to identify your most effective content.
And the visitor actions table includes both bounce rate and time on site, so you can quickly tell which pages have the most engagement.
Data display is a strength for Piwik, as you have access to overview charts while simultaneously being able to drill deeper.
An excellent tool for data visualization, it presents information in an appealing visual format—an exceptional platform for storing and analyzing data in any size organization.
Through interactive parameters, it enables real-time interaction with the user and is easy to learn and get support from the community.
From a user security standpoint it would be useful to provide users the ability to have two-factor authentication. While stats data is not necessarily sensitive in aggregate, some users may feel that certain portions need to be more secure.
It would be nice if there was a tighter integration with the Google search/referrer API so that "keyword not defined" would be replaced more often with the actual keyword that is being used to send a visitor to a site.
An easier branding method, maybe in the form of an API function set, that pulled branding URLs from a set of database fields would be great as well.
At this point, there is not a single conceivable reason as to why we would not renew and continue to use Piwik Analytics. Especially since it is a free program and open source. The product will only get better over time as more people look into it and donate to cause so that development can continue.
Our use of Tableau Desktop is still fairly low, and will continue over time. The only real concern is around cost of the licenses, and I have mentioned this to Tableau and fully expect the development of more sensible models for our industry. This will remove any impediment to expansion of our use.
Piwik succeeds in presenting me (and my associates and my clients...) large amounts of data in a user friendly way. The interface and functionality can easily be customized. While some enhancements do need technical background (API calls by programming language from the webserver or javascript), others are easy to use (goal / event tracking)
Tableau Desktop has proven to be a lifesaver in many situations. Once we've completed the initial setup, it's simple to use. It has all of the features we need to quickly and efficiently synthesize our data. Tableau Desktop has advanced capabilities to improve our company's data structure and enable self-service for our employees.
When used as a stand-alone tool, Tableau Desktop has unlimited uptime, which is always nice. When used in conjunction with Tableau Server, this tool has as much uptime as your server admins are willing to give it. All in all, I've never had an issue with Tableau's availability.
Tableau Desktop's performance is solid. You can really dig into a large dataset in the form of a spreadsheet, and it exhibits similarly good performance when accessing a moderately sized Oracle database. I noticed that with Tableau Desktop 9.3, the performance using a spreadsheet started to slow around 75K rows by about 60 columns. This was easily remedied by creating an extract and pushing it to Tableau Server, where performance went to lightning fast
The best thing about the Matomo support is that they have a forum which basically you can find the answer to almost all of your questions and most of the time you don't need to contact them regarding your questions and problems but if you need help they will answer in a reasonable time slots.
Tableau support has been extremely responsive and willing to help with all of our requests. They have assisted with creating advanced analysis and many different types of custom icons, data formatting, formulas, and actions embedded into graphs. Tableau offers a weekly presentation of features and assists with internal company projects.
It is admittedly hard to train a group of people with disparate levels of ability coming in, but the software is so easy to use that this is not a huge problem; anyone who can follow simple instructions can catch up pretty quickly.
I think the training was good overall, but it was maybe stating the obvious things that a tech savvy young engineer would be able to pick up themselves too. However, the example work books were good and Tableau web community has helped me with many problems
Again, training is the key and the company provides a lot of example videos that will help users discover use cases that will greatly assist their creation of original visualizations. As with any new software tool, productivity will decline for a period. In the case of Tableau, the decline period is short and the later gains are well worth it.
It is much more robust out of the box, easier to set up and more intuitive to use. The reports are set up already and it requires little to no setup after installation to start gathering insights.
I have used Power BI as well, the pricing is better, and also training costs or certifications are not that high. Since there is python integration in Power BI where I can use data cleaning and visualizing libraries and also some machine learning models. I can import my python scripts and create a visualization on processed data.
Tableau Desktop's scaleability is really limited to the scale of your back-end data systems. If you want to pull down an extract and work quickly in-memory, in my application it scaled to a few tens of millions of rows using the in-memory engine. But it's really only limited by your back-end data store if you have or are willing to invest in an optimized SQL store or purpose-built query engine like Veritca or Netezza or something similar.
Tableau was acquired years ago, and has provided good value with the content created.
Ongoing maintenance costs for the platform, both to maintain desktop and server licensing has made the continuing value questionable when compared to other offerings in the marketplace.
Users have largely been satisfied with the content, but not with the overall performance. This is due to a combination of factors including the performance of the Tableau engines as well as development deficiencies.