Tableau Desktop is a data visualization product from Tableau. It connects to a variety of data sources for combining disparate data sources without coding. It provides tools for discovering patterns and insights, data calculations, forecasts, and statistical summaries and visual storytelling.
$1,380
per year (purchased via a Creator license)
ThoughtSpot
Score 8.5 out of 10
N/A
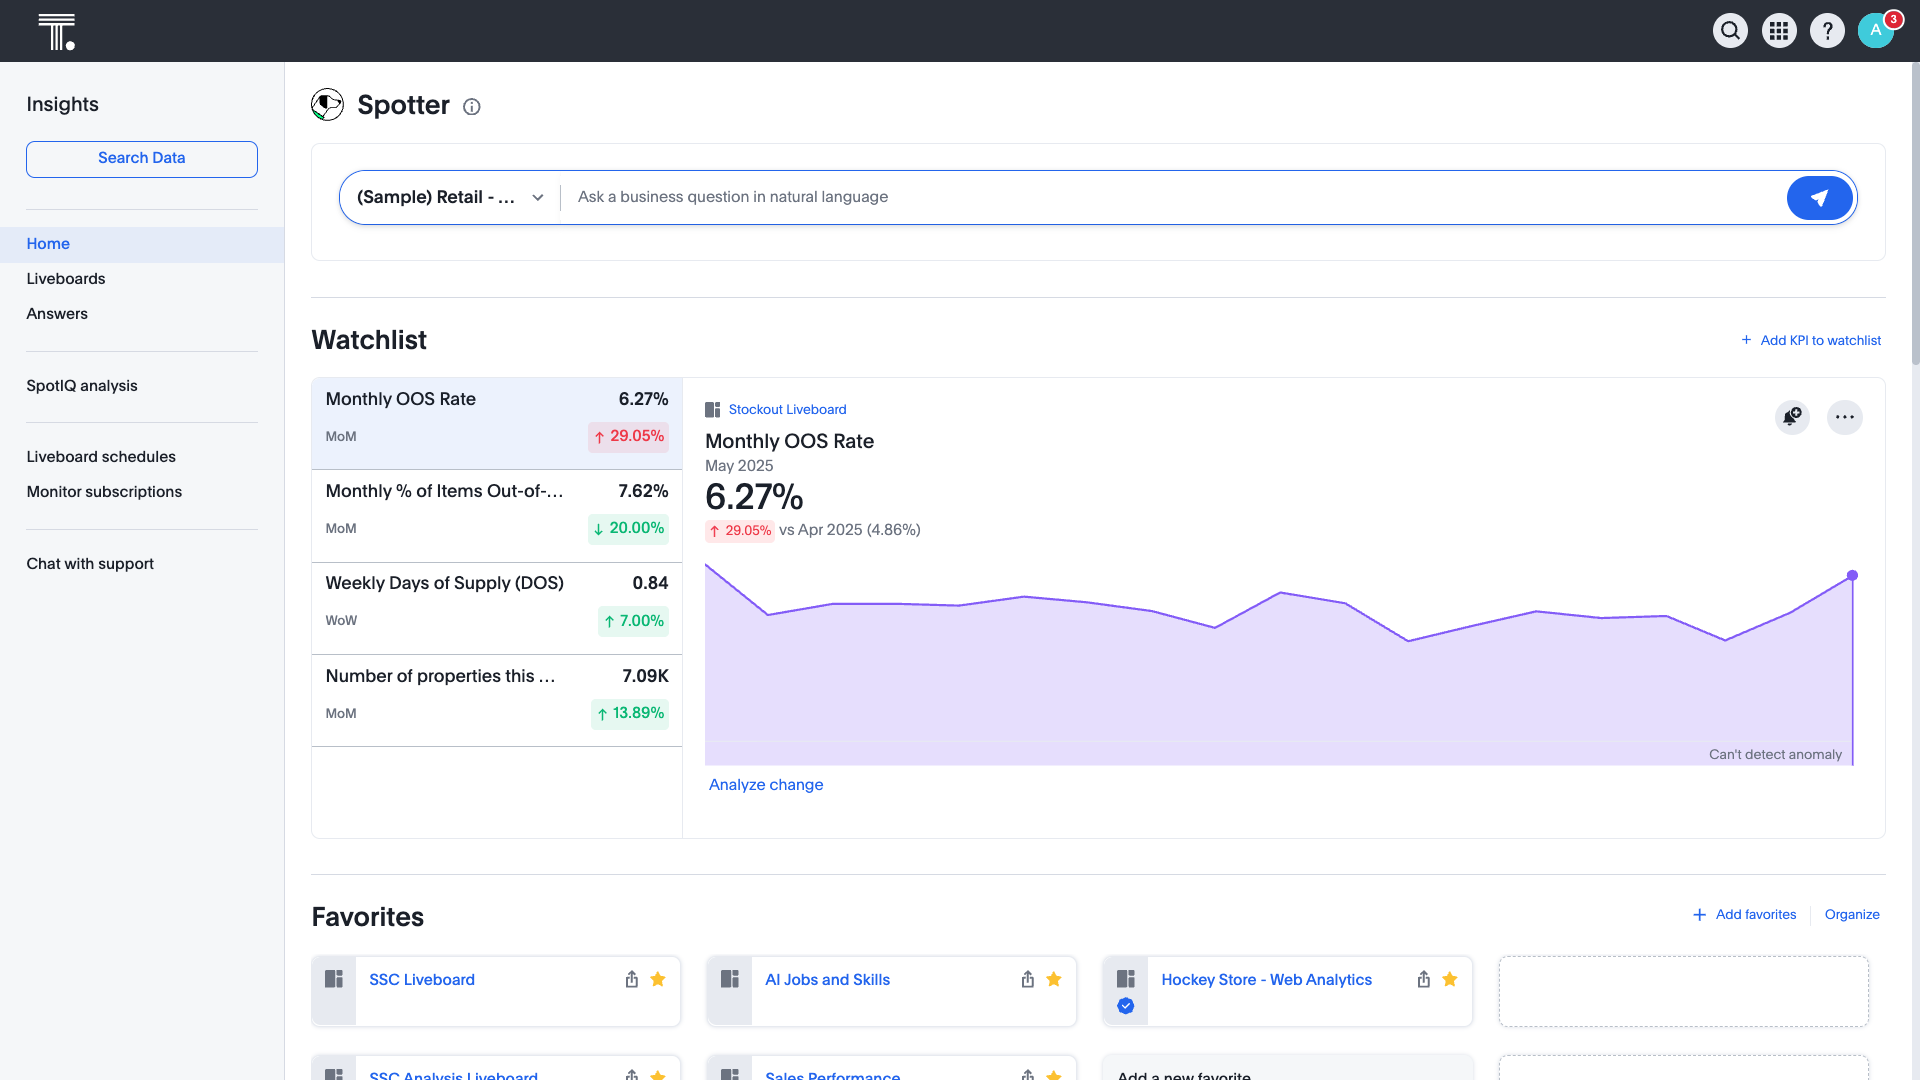
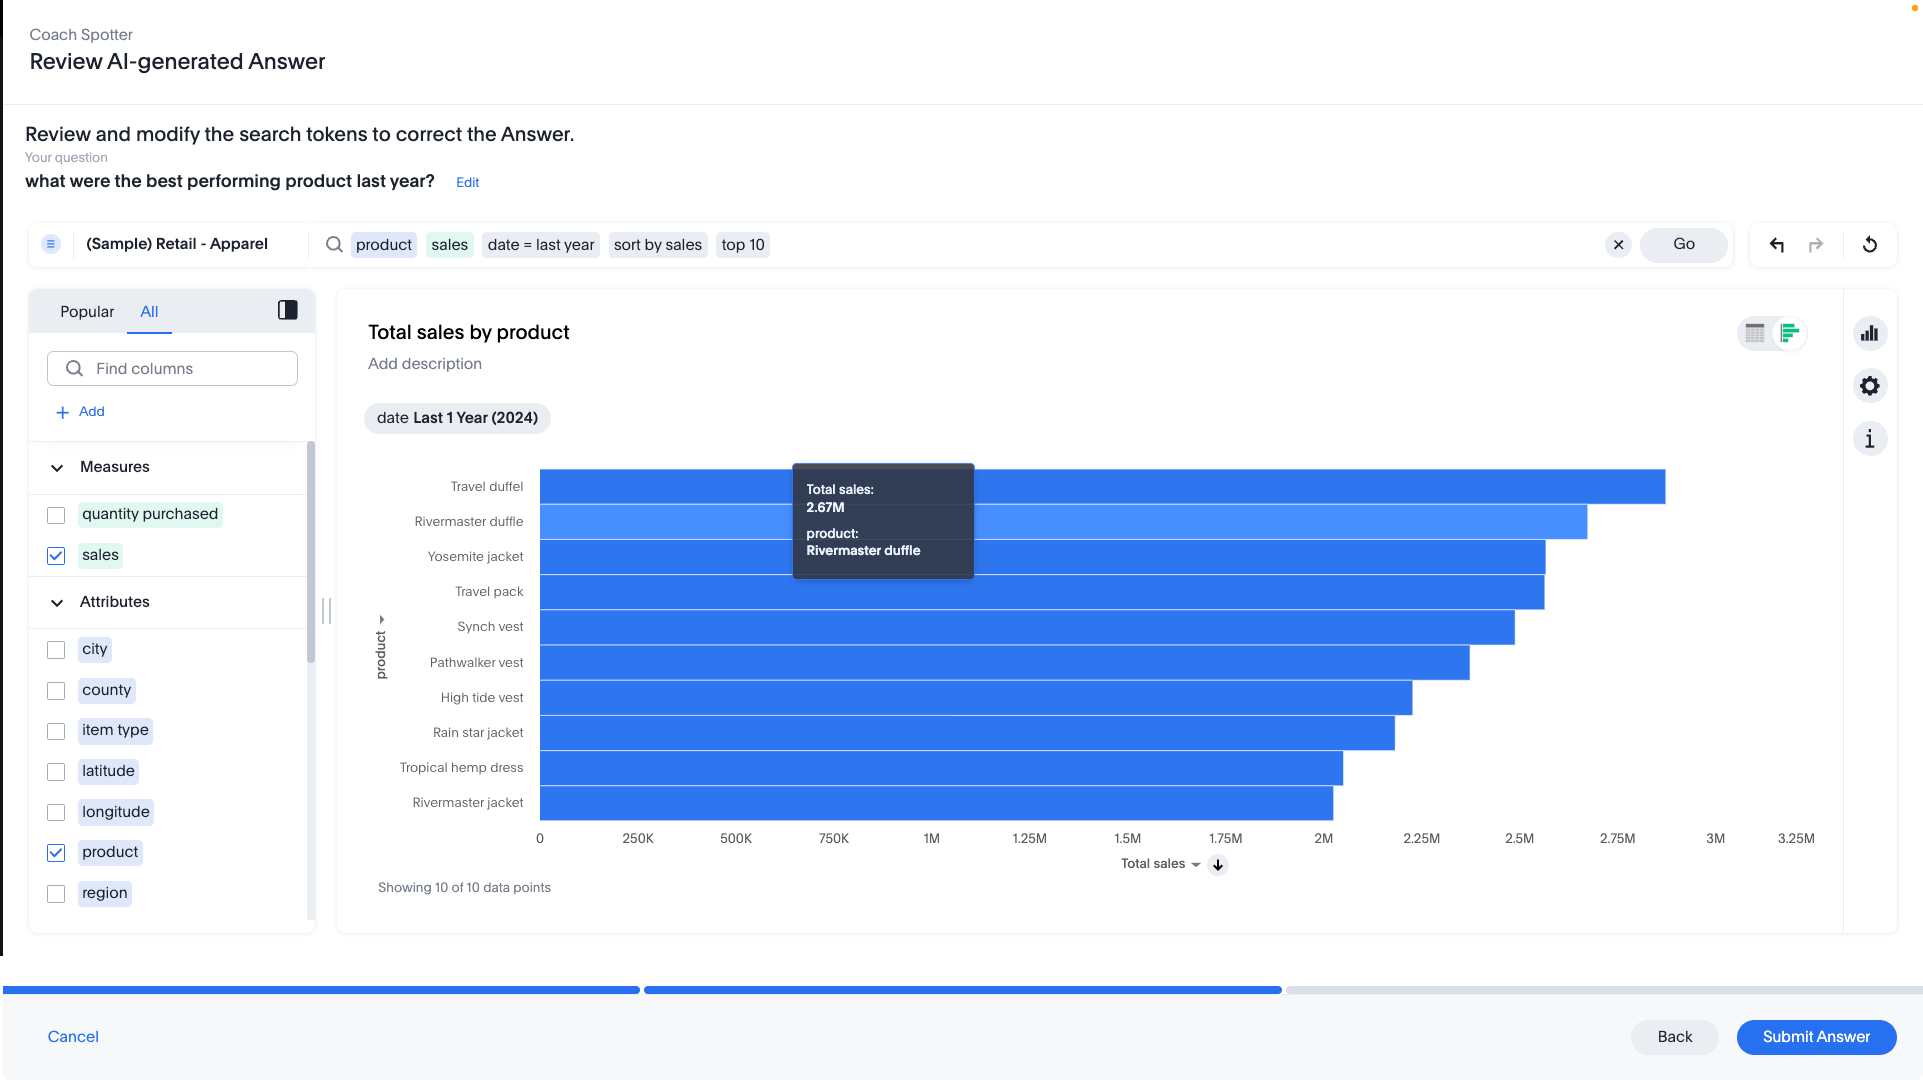
ThoughtSpot is an Agentic Analytics Platform for enterprises where users ask data questions using natural language and get answers with AI. Code-first for data teams and code-free for business users, ThoughtSpot can handle large, complex cloud data at scale.
$1,500
per year (5 users)
Pricing
Tableau Desktop
ThoughtSpot
Editions & Modules
Tableau Creator License
$115
per month (billed annually) per user
Thoughtspot Analytics - Pro
$50
per month (billed annually) per user (25-1000 users)
Thoughtspot Analytics - Enterprise
Custom
Offerings
Pricing Offerings
Tableau Desktop
ThoughtSpot
Free Trial
No
Yes
Free/Freemium Version
Yes
Yes
Premium Consulting/Integration Services
Yes
Yes
Entry-level Setup Fee
No setup fee
Optional
Additional Details
All pricing plans are billed annually. A Creator license includes Tableau Desktop, Tableau Prep Builder, and Tableau Pulse. Discounts sometimes available for volume.
Tableau is indeed better than ThoughtSpot (as of now), but the license for Tableau is expensive. ThoughtSpot integrates BI with AI, which kind of looks like the future.
We have been using Tableau as the enterprise reporting tool and felt sending data to external people had few restrictions hence we tried with ThoughtSpot.
Thoughtspot is a fairly new tool when compared to Tableau. I'll just list the benefits of each one of threse below - Tableau - 1. Much more customizable the Thoughtspot
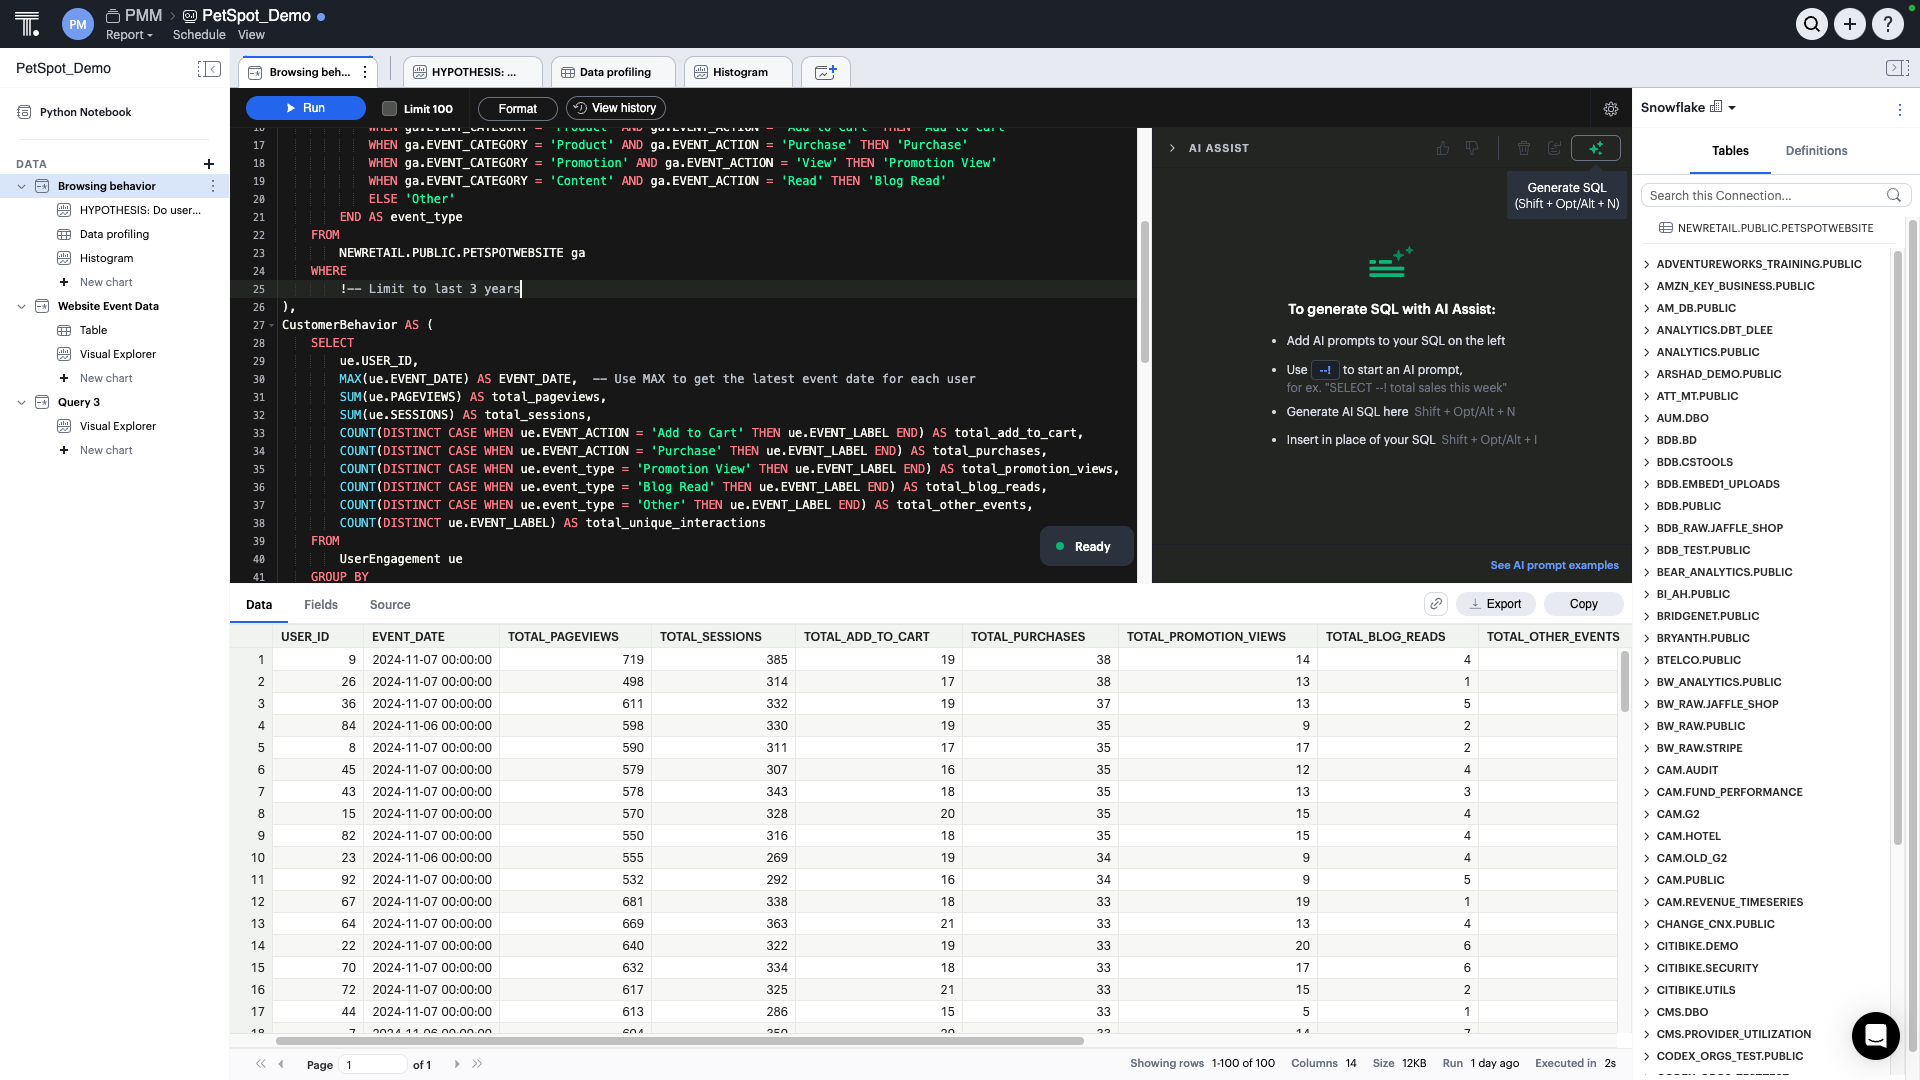
It is more cost effective when compared to Tableau and more easy to use. ThoughtSpot integrates well with modern cloud data platforms like Snowflake, Google, and Bigquery, making it easy to analyze large datasets in real time. Sync insights into cloud tools. Users can sync …
It stacks up well against these modern BI tools. These are the most popular tools and its ability to perform well with live connections gives it an advantage. However, having more control over formatting/customization would allow it to go further. Plus, developing a stronger …
ThoughtSpot's user friendly interface, faster and accurate results, low-code support for building insights and vast availability of native charts, AI powered dashboards helps in faster decision making and helps in driving better business results. The mobile APP that ThoughtSpot …
ThoughtSpot is the leader in embedded analytics and is much easier to work with massive volumes of data. None of the other tools listed had both of those functionalities, which were most important to us. There are other features that they have such as easier drill down, …
Compare to Kibana, which was we used previously, ThoughtSpot is definitely better in terms of UI, visualizations, usability, and the SpotIQ/ML components. The only disadvantage for ThoughtSpot is the lack of drill-down function/click-on filters.
The main reason for selecting Thoughtspot was to share reporting with other external vendors and ease of doing business.
Verified User
Manager
Chose ThoughtSpot
We selected ThoughtSpot with the promise that it would evolve into a Google search for business insights. To date, it has not gotten close in my opinion.
ThoughtSpot is far cheaper and easier to deploy than several of the larger players in the industry. I'd have no concerns in recommending ThoughtSpot to anyone considering a similar solution.
While Thoughtspot runs on "keyword search" technology, it needs the users to import data and build the data model in thoughtspot which creates a duplicate copy of your data mart. Answer Rocket uses "NLP (Natural Language Processing)" to work on your existing database and while …
In ad-hoc reporting...ThoughtSpot is superior in speed-to-results. The other products are capable, however, they require SQL coding and setup that ThoughtSpot only requires on initial load of data. Both PowerBI and ThoughtSpot use a text-based "natural language" query engine, …
ThoughtSpot is just as good at creating the initial graphic for the end user, it might even be better because the user really does not need much technical knowledge in order to create a basic graphic. Currently, ThoughtSpot cannot yet compete with the other tools when it comes …
The best scenario is definitely to collect data from several sources and create dedicated dashboards for specific recipients. However, I miss the possibility of explaining these reports in more detail. Sometimes, we order a report, and after half a year, we don't remember the meaning of some data (I know it's our fault as an organization, but the tool could force better practices).
It is well suited when the same data is consumed by many different people with different analytics and visualization requirements because, if you have the data available in ThoughtSpot, every user can prepare different views. Also, it is a good reporting tool, you can get rid of slides if you have a good dashboard prepared, gaining flexibility and agility.
An excellent tool for data visualization, it presents information in an appealing visual format—an exceptional platform for storing and analyzing data in any size organization.
Through interactive parameters, it enables real-time interaction with the user and is easy to learn and get support from the community.
Beautiful visualizations. The visuals are distinct, clean, and easy to discern from one another.
Intelligent querying functionality. When looking to manipulate the data, the search function makes it easy to manipulate the features in the data, along with aggregating them in the way you'd like.
Embedding! It has been a smooth process thus far for our product & technical teams to work with ThoughtSpot and bring it into our product.
It would be great if ThoughtSpot can add the feature to filter by clicking on visualizations. i.e if I click on a particular data point in the chart if the full dashboard can filter just for that particular data point.
Color coding the heatmap with different colors like green to orange to red.
Our use of Tableau Desktop is still fairly low, and will continue over time. The only real concern is around cost of the licenses, and I have mentioned this to Tableau and fully expect the development of more sensible models for our industry. This will remove any impediment to expansion of our use.
I give it just waiting because passport is brilliant and it has helped our organisation In advancing to the next stage in the age of AI. It has allowed or non-tech people to better service and clients in a cost-effective way. George port has allowed us to create new products for us and for our clients increasing our revenue streams and reducing clients churn
Tableau Desktop has proven to be a lifesaver in many situations. Once we've completed the initial setup, it's simple to use. It has all of the features we need to quickly and efficiently synthesize our data. Tableau Desktop has advanced capabilities to improve our company's data structure and enable self-service for our employees.
The rating is because of the ease of use of the interface as it has a no code interface that makes it easy to setup data pipelines without extensive programming. Cloud native integration: It integrates seamlessly with cloud based data warehouses. Automated data loading, Scalability, Cost Effective, Transformations, Data Governance and security.
When used as a stand-alone tool, Tableau Desktop has unlimited uptime, which is always nice. When used in conjunction with Tableau Server, this tool has as much uptime as your server admins are willing to give it. All in all, I've never had an issue with Tableau's availability.
Tableau Desktop's performance is solid. You can really dig into a large dataset in the form of a spreadsheet, and it exhibits similarly good performance when accessing a moderately sized Oracle database. I noticed that with Tableau Desktop 9.3, the performance using a spreadsheet started to slow around 75K rows by about 60 columns. This was easily remedied by creating an extract and pushing it to Tableau Server, where performance went to lightning fast
Tableau support has been extremely responsive and willing to help with all of our requests. They have assisted with creating advanced analysis and many different types of custom icons, data formatting, formulas, and actions embedded into graphs. Tableau offers a weekly presentation of features and assists with internal company projects.
I give it this meeting because the team is not only help able to help us in the current solutions but also amazing and taking feedback and feeding it back to their development team which includes more products and features into ThoughtSpot
It is admittedly hard to train a group of people with disparate levels of ability coming in, but the software is so easy to use that this is not a huge problem; anyone who can follow simple instructions can catch up pretty quickly.
I think the training was good overall, but it was maybe stating the obvious things that a tech savvy young engineer would be able to pick up themselves too. However, the example work books were good and Tableau web community has helped me with many problems
Again, training is the key and the company provides a lot of example videos that will help users discover use cases that will greatly assist their creation of original visualizations. As with any new software tool, productivity will decline for a period. In the case of Tableau, the decline period is short and the later gains are well worth it.
I have used Power BI as well, the pricing is better, and also training costs or certifications are not that high. Since there is python integration in Power BI where I can use data cleaning and visualizing libraries and also some machine learning models. I can import my python scripts and create a visualization on processed data.
We also explored Tableau Ask Data. Tableau is our standard for BI in our organization. We want to use the smallest amount of tools in our company to have the best adaption. ThoughSpot will fill a few gaps that we have with our current set up and will also enhance out offering for our employees in the transition of being more data driven within in near future
Tableau Desktop's scaleability is really limited to the scale of your back-end data systems. If you want to pull down an extract and work quickly in-memory, in my application it scaled to a few tens of millions of rows using the in-memory engine. But it's really only limited by your back-end data store if you have or are willing to invest in an optimized SQL store or purpose-built query engine like Veritca or Netezza or something similar.
Because it is very reliable, inside the situation, we need strong internet connection to access a lot of data but easily never had any downtime except during the upgrades
Tableau was acquired years ago, and has provided good value with the content created.
Ongoing maintenance costs for the platform, both to maintain desktop and server licensing has made the continuing value questionable when compared to other offerings in the marketplace.
Users have largely been satisfied with the content, but not with the overall performance. This is due to a combination of factors including the performance of the Tableau engines as well as development deficiencies.
Time to market ROI is massive vs hiring the full-time dedicated team to build and maintain a frontend multi-tenant SaaS data viz product.
It will be interesting to see over time how the advanced features play out in terms of usability and end value, such as Natural Search, which we are very excited about, and the machine learning tools.