Discrete vs. Continuous Data
For many professionals, modern data analytics may make them wish they’d paid more attention in middle school math class. Mathematical concepts like “discrete data” and “continuous data” now form the foundation for the business world’s information environments. Decisions about how data is collected, stored, and processed have far-reaching and unpredictable consequences.
Most business data is either discrete or continuous. There are also key differences between the two. These distinctions impact how professionals use the data. Understanding the difference between discrete and continuous data, and why the differences matter, can make (or break) your analyses.
What is Discrete Data?
Discrete data refers to countable, individualized items. These items are not divisible. Instead, they only exist in set increments or units.
Discrete variables only have a limited number of possible values. In other words, they are finite, with a set number of intervals or categorical values. A key characteristic of discrete data is that it is “countable,” versus being “measurable.”
We often visualize discrete data with bar graphs, histograms, and other non-persistent methods.
Discrete data can encompass a wide range of other data types. For instance, it handles ordinal data, such as sliding scales (i.e. “bad, neutral, good”). It also allows users to quantify qualitative data, such as the number of green cars on a road.
Discrete data is:
- Numerical, whole, non-negative numbers or values
- Easily visualized on charts, graphs, histograms, etc
- “Simple,” in whole numbers or values
- Impossible to divide into parts
It is important to remember that discrete data does NOT have to be numbers! A perfect example of this is letter grading systems. A student cannot receive half of an A, and must receive a letter on the predetermined scale. It is a clearly defined set of values with determined boundaries, and thus fits this category.
Discrete data has limited granularity. Users can only subdivide discrete data to its smallest unit. This can inhibit some level of specificity in discrete data values. It also allows users to work with discrete integers more quickly and easily.
Examples of Discrete Data
Discrete data often describes physical or material entities. For instance, the number of students in a classroom is a discrete value. A store’s inventory of computers is a discrete variable, because there are a set amount of computers within the inventory. No one would count “17.5 devices.” Similarly, the number of employees at a business is a discrete value.
What is Continuous Data?
Continuous data is data that is measurable, versus being countable. Continuous variables use increments that are dividable and subcountable. In other words, continuous variables could go on forever. Continuous data is only limited by the practical volume of the data or the specificity of the measurements in question.
We often visualize this type of data in line graphs, trend lines, percentages, averages, and other non-stop, divisible methods.
Continuous data allows for much more granularity and specificity. Physical measurements of continuous data, such as weight, is as detailed as the measurement tool allows. Analytics tools can also get even more detailed. Continuous data can be as detailed as it is useful. For instance, web analytics products often specify to hundredths of a percent. Commercial and industrial use cases rely on this accuracy to maximize efficiency.
Continuous data is:
- Measurements using standard units
- Determined by the method used to measure
- Is indivisible
- Often precise down to multiple decimal places
Examples of Continuous Data
Continuous data is most data that users measure via an external scale. An item’s weight, a person’s height, even and time are common examples. In a business context, continuous data includes product dimensions and time spent on a website. Abstract measurements are also continuous, such as productivity or efficiency measurements.
What’s the Difference Between Discrete and Continuous Data?
There is a key difference in definitions between discrete and continuous data. Discrete data is finitely countable, while continuous data is technically infinite. Discrete data can be handled on something as simple as a number line, while continuous data is more complex. There are several practical differences between discrete and continuous data as well.
Continuous data allows for more (technically infinite) granularity. In contrast, discrete data is limited to a preset level of specificity. In some cases, discrete data offers more simplicity. This can be preferable in cases where users need quick, easy, high-level access to data.
A good way to understand the difference is in the different ways we examine student performance. On an individual assignment, we may say Timmy got an A, 95 questions right, and turned in 3 assignments last week. On a broader level, we could say that 12 students got A’s, 15 B’s, and so on, with 50 total assignments submitted. These are all examples of discrete data.
We can also say Timmy is averaging 9.33/10 answers correct, or 93.3%. This is an example of continuous data. With continuous data, we can use averages to evaluate things beyond the literal. He is not literally answering a third of a question, yet this is a way to quickly examine his performance over an entire semester.
| Discrete Data | Continuous Data |
| Countable | Not Countable (Infinite) Requires External Measurement/Scale |
| Cannot Be Divided Past Its Base Unit | Subdivisible |
| Less Granularity | More Granularity |
| Includes Ordinal and Integer Values | Includes Quantitative Data Like Fractions,Percentages, and Decimal Numbers |
The Importance of Continuous and Discrete Data
Generally, continuous data is the go-to structure for business use. However, both types of data play key roles. There are some kinds of data that cannot be continuous. Counts of inventory, or employees, should be tracked as their discrete values. If businesses use discrete data to create continuous values, they still maintain the original discrete values. In practice, businesses use discrete and continuous data points on a daily basis. Each data type is simply easier or more valuable in certain contexts.
How Businesses Use Continuous and Discrete Data
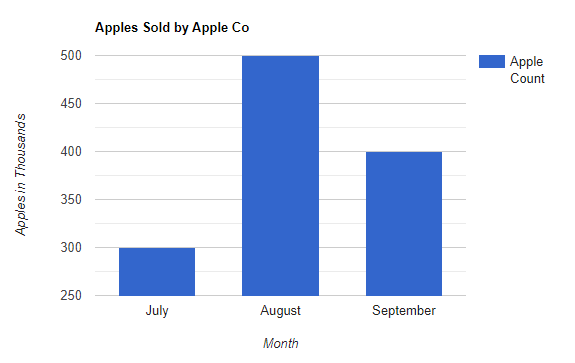
An easy way to understand the difference in utility between the two data types is to discuss them in a business context, perhaps with an imaginary apple company. Using discrete information, we can discuss:
- Apples sold in the month of August
- Units of fuel used in transport
- Dollar amount of profit and expenses in August
- Number of trucks that broke down
This information is easily visualized in bar charts, and great for quick information. These are essential data points for keeping a company flowing. As a reputable company, we didn’t sell half apples.
In most modern business cases, continuous data is the preferred structure. The aggressive pace of efficiency and optimization makes specificity a must for businesses. This results in a greater value placed on continuous data, which allows for more detailed measurements.
In our apple company, continuous data will discuss things such as averages. Average apples sold per unit of fuel consumed, then by region, then by city. We can examine spoilage rates and trend lines.
To demonstrate why this is so useful, here is an example of similar information, portrayed using continuous data versus discrete. If you are in charge of product quality, and went to your boss and reported 10,000 spoiled apples in July, and 12,000 in August, you have presented a rise in spoilage.
With continuous data, you could report that apple spoilage is down from 3.3% to 2.4%. This is obviously a vast oversimplification but shows the relative utility of both in a professional setting.
To get more nuanced and less simplistic, modern businesses often use continuous and discrete data hand-in-hand. Business processes will even convert discrete data to continuous data during analysis. Processes like regression analysis are common examples of this phenomenon. Take Net Promoter Scores (NPS) for example. This data point measures how likely users would recommend a product. NPS values start as discrete data (whole numbers between 1-10).
A pool of discrete ratings on its own isn’t very helpful. Instead, a data analyst averages all NPS ratings to get an average NPS score. Depending on the averaged discrete values, the average NPS score could be specified as a continuous value, such as 7.483.
This granularity is crucial to tracking changes in the NPS score over time. Continuous NPS data can capture even small trends in the score over time. The business will also keep the original discrete values for data integrity.
While simple in theory, few if any of these data analyses occur by hand. Instead, businesses use a range of statistical analysis software to surface business insights. These tools handle both continuous and discrete data inputs. The tools’ outputs are almost always continuous since the tools seek the most accuracy and specificity possible. Some of the most common types of analytics software include:
- Mobile Analytics Tools
- Web Analytics Tools
- Predictive Analytics Software
- Business Intelligence (BI) Tools
Most industries and professions also have some tailored analytics tools available. These tools should handle discrete and continuous data. They may vary in how quick or efficient they handle the data. Discrete data is easier to work with computationally, and is also more limited. It is also less reliant on advanced software to process, but can still benefit from proper tools at scale. Continuous data is a much heavier computational lift. It can also surface much more advanced/nuanced insights with the correct tools.
For those looking for a video version of this explanation, below you will find a fantastic video that goes over the differences in detail.
For those that have used platforms in any of the software categories we have discussed please leave a review to help other buyers make informed decisions.
Was this helpful?