TrustRadius
ScienceLogic SL1

ScienceLogic SL1

Overview

What is ScienceLogic SL1?

ScienceLogic is a system and application monitoring and performance management platform. ScienceLogic collects and aggregates data across and IT ecosystems and contextualizes it for actionable insights with the SL1 product offering.

Read more
Recent Reviews
Read all reviews

Awards

Products that are considered exceptional by their customers based on a variety of criteria win TrustRadius awards. Learn more about the types of TrustRadius awards to make the best purchase decision. More about TrustRadius Awards

Reviewer Pros & Cons

View all pros & cons

Video Reviews

1 video

ScienceLogic SL1 Review: Provides Integration Flexibility When Managing Large Volume of Devices
02:00
Return to navigation

Pricing

View all pricing

Entry-level set up fee?

  • Setup fee required
For the latest information on pricing, visithttps://www.sciencelogic.com/pricing

Offerings

  • Free Trial
  • Free/Freemium Version
  • Premium Consulting/Integration Services

Starting price (does not include set up fee)

  • $7.50 per month per node
Return to navigation

Product Details

What is ScienceLogic SL1?

The ScienceLogic SL1 platform aims to enable companies to digitally transform themselves by removing the difficulty of managing complex, distributed IT services. SL1 uses patented discovery techniques to find everything in a network, so users get visibility across all technologies and vendors running anywhere in data centers or clouds. The vendor states the advantage of SL1 is that it collects and analyzes millions of data points across an IT universe (made up of infrastructure, network, applications, and business services), to help users make sense of it all, share data, and automate IT processes.


With SL1, the user can:

  • See everything across cloud and distributed architectures. Discover all IT components—–across physical, virtual, and cloud. Collect, merge, and store a variety of data in a clean, normalized data lake.
  • Contextualize data through relationship mapping and machine learning (ML) for actionable insights. Use this context to understand the impact of infrastructure and applications on business service health and risk, accelerate root cause analysis, and execute recommended actions.
  • Act on data that is shared across technologies and IT ecosystem in real time. Apply multi-directional integrations to automate workflows at cloud scale.

ScienceLogic SL1 Features

  • Supported: Infrastructure Monitoring (Cloud, Container, Server, Storage, Agent-Based, Network, Application, Database, UC/Video, Synthetic)
  • Supported: Closed-Loop Automations (Digital Experience Monitoring, CMDB & Inventory, Incident & Notifications, NetFlow, Configuration and Change Management, Troubleshooting & Remediation
  • Supported: Topology-Driven Event Correlation
  • Supported: Full-Stack Topology Mapping
  • Supported: Business Service Monitoring
  • Supported: Behavioral Correlation (Events, Changes, Anomalies, Topology)
  • Supported: Analytics - ML-Based Anomaly Detection
  • Supported: Incident Automation - Event Forwarding & Email
  • Supported: Dynamic Baselining Analytics
  • Supported: Manage Workflow Health & Endpoints
  • Supported: Dashboards and Reporting
  • Supported: Log Collection
  • Supported: 400+ Pre-Built Monitoring Integrations

ScienceLogic SL1 Screenshots

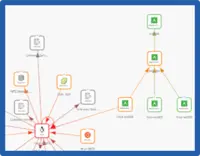
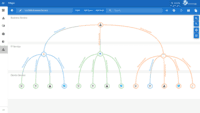
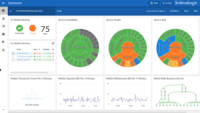
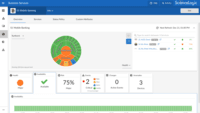
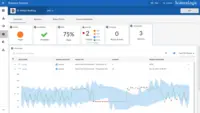
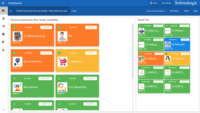
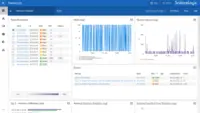
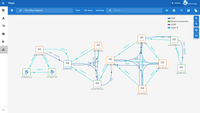
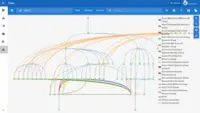
Screenshot of Application to infrastructure mapping with APM toolsScreenshot of CRM Business Service MapScreenshot of Mobile Banking Business Service Dashboard OverviewScreenshot of Mobile Banking Business Service Dashboard Availability ViewScreenshot of Mobile Banking Business Service Dashboard Anomalies ViewScreenshot of Business Services Leaderboard Dashboard OverviewScreenshot of Network Hotsheet DashboardScreenshot of Office Network MapScreenshot of Azure Map

ScienceLogic SL1 Videos

ScienceLogic SL1 Integrations

  • Kubernetes
  • Cisco HyperFlex
  • Nimble
  • Hyper-V
  • MySQL
  • Dynatrace
  • New Relic
  • Cloud -AWS
  • Azure
  • Google Cloud
  • IBM Cloud
  • Aliyun
  • CloudStack
  • OpenStack
  • etc.
  • Cloud Services – Amazon EKS
  • ECS
  • Fargate; Azure AKS; etc.
  • Containers – Docker
  • etc.
  • Software-defined Networks/WAN – Cisco
  • VMware
  • etc.
  • Network - Cisco
  • F5
  • Juniper
  • Meraki
  • Riverbed
  • Aruba
  • Avaya
  • Fortinet
  • HP
  • etc.
  • Storage - Dell EMC
  • NetApp
  • HPE
  • Hitachi
  • Nutanix
  • Pure Storage
  • etc.
  • Hypervisors – VMware
  • Xen
  • KVM
  • etc.
  • Operating Systems - Unix
  • Windows
  • Linux
  • Business Applications
  • Databases - Microsoft
  • SAP
  • Office 365
  • MS SQL Server
  • Oracle
  • IBM DB2
  • etc.
  • APM - AppDynamics
  • etc.
  • etc.
  • Storage - Dell EMC
  • NetApp
  • Pure
  • HP/Nimble
  • etc.
  • Cloud -AWS
  • Azure
  • Google
  • IBM
  • Aliyun
  • Openstack
  • etc.
  • Applications -Microsoft
  • SAP
  • etc.
  • Compute -VMWare
  • Microsoft Hyper-V
  • KVM
  • Linux
  • Unix
  • Converged -Nutanix
  • Unified Communications and video - Cisco
  • Polycom
  • Tandberg

ScienceLogic SL1 Competitors

ScienceLogic SL1 Technical Details

Deployment TypesOn-premise, Software as a Service (SaaS), Cloud, or Web-Based
Operating SystemsWindows, Linux, Mac, UNIX
Mobile ApplicationNo
Supported CountriesAmericas, EMEA, APAC
Supported LanguagesEnglish

Frequently Asked Questions

ScienceLogic is a system and application monitoring and performance management platform. ScienceLogic collects and aggregates data across and IT ecosystems and contextualizes it for actionable insights with the SL1 product offering.

ScienceLogic SL1 starts at $7.5.

LogicMonitor, Datadog, and Moogsoft are common alternatives for ScienceLogic SL1.

Reviewers rate Configurability highest, with a score of 10.

The most common users of ScienceLogic SL1 are from Enterprises (1,001+ employees).

ScienceLogic SL1 Customer Size Distribution

Consumers0%
Small Businesses (1-50 employees)0%
Mid-Size Companies (51-500 employees)0%
Enterprises (more than 500 employees)100%
Return to navigation

Comparisons

View all alternatives
Return to navigation

Reviews and Ratings

(380)

Attribute Ratings

Reviews

(26-50 of 207)
Companies can't remove reviews or game the system. Here's why
Score 9 out of 10
Vetted Review
Verified User
Incentivized
  • All types of Infra can monitor
  • Severity of Events
  • Maintenance mode of a device
  • notification need to be there before clicking on upgrade button
  • Notification need to be there before reboot collector
  • Delaying to present the current uptime when rebooted a collector
September 01, 2023

SL1 review

Score 8 out of 10
Vetted Review
Verified User
Incentivized
  • Manage the events Properly.
  • Dashboard is well designed and detailed.
  • By the help of this we can easily fetch the detailed reports
  • Sometimes, Report creates problem it not generated properly.
  • we can improve our automation policies
Score 9 out of 10
Vetted Review
ResellerIncentivized
  • Automation & low code/no code collection options.
  • Support for traditional data centers, cloud-native services and hyperscalers.
  • Multi-tenancy.
  • Increase out-of-the-box support for technologies not currently covered.
  • Improve reporting ease of use/customisation
Wian Crous | TrustRadius Reviewer
Score 9 out of 10
Vetted Review
Verified User
Incentivized
  • Best overall coverage of montioring different technologies.
  • Easy to use in any environment
  • Customizable being able to generate your own reports, dashboards, DA's, RBA's, etc.
  • Have very good out of the box integrations with other monitoring solutions such as ServiceNow
  • Always improving and regularly releasing new versions and upgrades to the system/DA's.
  • Interactive community
  • Their reporting is difficult and complicated to create your own. This can also be moved to a newer language (AP2 View)
  • Being able to use their API/GQL with SSO
Score 1 out of 10
Vetted Review
Verified User
Incentivized
  • It is effective for monitoring common devices
  • The ap2 interface is generally pleasant to use
  • PowerFlow
  • Support - time to resolution
  • Support - fast access to engineering
  • Cohesive UI/UX - why does the classic UI still exist?
  • Bug finding - we feel like glorified beta testers (see comments about support)
  • UX - if you have to explain how things work, you've failed. e.g. there are pages where three buttons all have the same text and all do different things!
  • utilisation of AI across the board.
Score 8 out of 10
Vetted Review
Verified User
Incentivized
  • snmp status
  • wan link up and down status
  • cpu usage and storage capacity
  • snmp status. doesn't always update when equipment is changed
  • discovery of certain equipment. ie. Brocade and HP
  • alarm suppression for certain groups instead of across the board
Score 10 out of 10
Vetted Review
Verified User
Incentivized
  • Root cause analysis: By analyzing the logs ScienceLogic SL1 will find out the root cause accurately
  • ScienceLogic SL1 employs proactive monitoring techniques to identify potential issues before they cause significant disruptions.
  • IT team can Customize Dashboards and Reports based on the requirement
  • Documentation should be expanded
  • If video related training is added it is great.
August 30, 2023

My ScienceLogic Review

Score 10 out of 10
Vetted Review
Verified User
Incentivized
  • It monitors our devices and reports on the detections we have created.
  • monitors web endpoints
  • can handle bespoke complex monitors
  • discovery of devices automatically
  • Most of the things I can think of have now been addressed in this new release.
  • Documentation could be less ambiguous sometimes
  • More active to detecting system alerts and having them sorted before we have need to inform them SAAS
Score 9 out of 10
Vetted Review
ResellerIncentivized
  • Easy to configure for monitoring devices of the same make and model.
  • Straightforward to develop powerpacks for new or updated devices.
  • Easy to configure for setting alerts on devices and device models.
  • Easy to create dashboards for device or service monitoring.
  • Creating powerpacks from scratch for new devices may be straightforward but will rarely be easy. Rewarding when completed, but not easy.
  • Developer documentation needs a rethink. While the information may be there (it isn't always) it is not easy to find. This is not helped by using different terms for the same things.
  • A developer console/dashboard for monitoring data collection from powerpacks instances without having to switch webpages or have to monitor multiple webpages.
Score 7 out of 10
Vetted Review
Verified User
  • Integrations with ServiceNow for CMDB population and alert escalation.
  • Customizable collections of performance and capacity metrics.
  • The ability to customize event policies for alerts.
  • Native multi-tenant features and functionality in the platform.
  • The legacy EM7 interface can be overwhelming with configuration options.
  • RBAC roles and policies can be difficult to manage for larger organizations.
  • PowerPacks are required for nearly every vendor's platform, which requires software development resources in-house, or having to work with ScienceLogic to request and prioritize support for new vendors.
Score 8 out of 10
Vetted Review
Verified User
  • Auto-Discovery feature is very good which helps us in building relationships between hyper-v and VMware host and guest devices. Also, it helps in building the relationship with MSSQL Databases.
  • Ability to perform bulk discovery and update in ScienceLogic.
  • Flexibility to clone the Dynamic Applications and do custom modifications.
  • Flexibility to create custom RBA's and do several automations.
  • Also ScienceLogic has come up with several new power packs for integrating with third party tool like ELK, Kubernetes etc which are readily available for use
  • OOB Reports (Availability and Capacity) are not very user-friendly and also do not fetch correct data most of the time or even show blank reports a lot of time. A very limited number of reports and that too very basic and do not comply with industry best practices (like Availability reports do not have a business and not business hour feature and even does not exclude the outages during scheduled maintenance)
  • Dashboards do not have a lot of widgets and are hence are not able to create complex dashboards. There should be the flexibility of adding an additional column on dashboards through Custom attributes.
  • Not possible to put only a few metrics (like DB services) in maintenance for a certain period. The entire server has to be put in maintenance mode and then even OS alerts get suppressed.
  • The audit logs page does not get loaded and gives "504 Gateway Time-out" most of the time
  • Every small customization is treated as PS work and PS is very costly.
  • The SL1 support team does not support and even does provide suggestions on issues on customized DA even if the issue is because of the built-in ScienceLogic functions. There are a lot of internal Dynamic Apps (Like for filesystem, services, processes, availability, etc) where there is no visibility on the logic of how alerts are configured.
Score 10 out of 10
Vetted Review
Verified User
Incentivized
  • Monitor diverse set of hardware and software
  • Provide single unified view of the current state of infrastructure
  • Application performance monitoring
  • Single view of all past alerts, not grouped by devices/monitored (i.e. "activity feed")
October 25, 2022

Feedback from a user.

Score 6 out of 10
Vetted Review
Verified User
Incentivized
  • Australia Support Engineer-Simon Lee provided very good support.
  • Provide more good customization options
  • Better support for various PowerPacks
Score 8 out of 10
Vetted Review
Verified User
Incentivized
  • Monitors the Infra efficiently
  • Auto Tickets to respective queues whenever any flaws in Infra
  • Email reminders gets for any CRITICAL issues on Infra
  • Auto Ticketing is a real time challenge.
  • When event gets changed from Minor to Major, the incident comes back to source queue
  • No location filter option in register to filter via device location wise
Score 9 out of 10
Vetted Review
Verified User
Incentivized
  • Monitors well. Anything that pops up is easy to see. We know where something went wrong.
  • Easy. Very easy to navigate and use the interface. The icons show what we are looking for.
  • Alerts are right. It doesn’t give out wrong information or tell us wrong stuff.
  • Better directions. Installing it was a problem because it was my first time doing it. I followed the directions but sometimes it was confusing.
  • More friendly for first time users. Again with the directions and knowing how to properly set it up would’ve helped.
  • Have more steps on how to set it up. Maybe a person could brief you on what you got and be able to come to you to help set up.
October 11, 2022

SL1 Simply

William DeOrnellas | TrustRadius Reviewer
Score 10 out of 10
Vetted Review
Verified User
Incentivized
  • Business Services are a welcome addition to the capabilities of the SL1 platform
  • Collections capabilities. Being able to ingest multiple forms of data streams to provide a more holistic view of an environment
  • Giving the clients the freedom to apply specific monitoring that is tailored to their environments
  • Ease of deployment of Business Services
  • A simplified view to represent multiple SL1 deployments in one place
Brian Vinson | TrustRadius Reviewer
Score 8 out of 10
Vetted Review
Verified User
Incentivized
  • Modularization; ability to add monitoring to new technologies via downloadable "power packs"
  • Customization and granularity of alerting
  • Big potential for automating processes for those with developer-like knowledge
  • Reports are confusing and crafting new ones is very tedious
  • Some basic functionality lacking in alerting (ex: cannot keep a dynamic list if one item is removed from it).
  • Web console and menus can be overwhelming for those without training.
Joseph Gaffney | TrustRadius Reviewer
Score 9 out of 10
Vetted Review
Verified User
Incentivized
  • Performance criteria
  • Error reporting and management
  • Flexibility to leverage custom tools
  • User experience and dashboarding, primarily catching up classic UI elements to the current design
  • Extending discovery and device identity
Return to navigation