TrustRadius
LogicMonitor

LogicMonitor

Overview

What is LogicMonitor?

LogicMonitor provides an agentless SaaS-based monitoring platform. LogicMonitor provides prebuilt integrations and an open API, and is designed to provide monitoring across networks, servers, applications, websites, and containers, including insights and reporting capabilities.

Read more
Recent Reviews
Read all reviews

Awards

Products that are considered exceptional by their customers based on a variety of criteria win TrustRadius awards. Learn more about the types of TrustRadius awards to make the best purchase decision. More about TrustRadius Awards

Reviewer Pros & Cons

View all pros & cons
Return to navigation

Pricing

View all pricing

Enterprise

Contact sales team

Cloud

Website Monitoring

Contact sales team

Cloud

Entry-level set up fee?

  • No setup fee
For the latest information on pricing, visithttps://www.logicmonitor.com/pricing

Offerings

  • Free Trial
  • Free/Freemium Version
  • Premium Consulting/Integration Services
Return to navigation

Product Details

What is LogicMonitor?

LM Envision is a SaaS-based unified observability platform that enables digital enterprises to adopt a cloud-ready operating model for meeting key business demands. LM Envision provides clarity across hybrid enterprise IT, brings diverse IT and development teams together to solve complex problems, and enables IT to innovate faster while improving operational efficiency to the critical IT services they deliver.

LM Envision aims to offer an alternative to the tool sprawl that exists in many organizations today. By leveraging a platform that enables collection, analysis, contextualization insights and exploration of observability data across traditional and modern environments, it helps IT teams to remove the blind spots that come from siloed monitoring tools. And it enables IT teams to rally around a platform that offers a “single source of truth” to quickly triage and resolve problems, leverage AIOps to spot performance trends, and shift their time and investment from operation tasks to work that drives innovation for the enterprise.

LogicMonitor Features

  • Supported: Infrastructure Monitoring
  • Supported: Network Monitoring
  • Supported: Cloud Monitoring
  • Supported: Logs
  • Supported: Server Monitoring
  • Supported: Remote Monitoring
  • Supported: AIOps (data forecasting, root cause analysis, dynamic thresholds)
  • Supported: Database Monitoring
  • Supported: Container Monitoring
  • Supported: Synthetic Website Monitoring
  • Supported: APM
  • Supported: Storage Monitoring
  • Supported: Virtual Machine Monitoring
  • Supported: Configuration Monitoring
  • Supported: Topology Mapping
  • Supported: Customizable Dashboards
  • Supported: Alert Escalation Chains
  • Supported: Reporting
  • Supported: Alerting
  • Supported: 24x7 Live Technical Engineer Support

LogicMonitor Screenshots

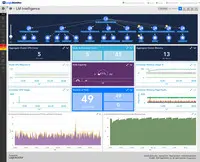
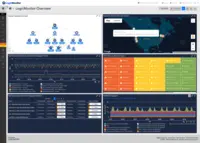
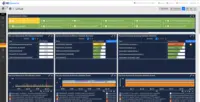
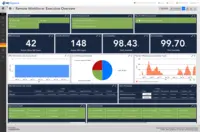
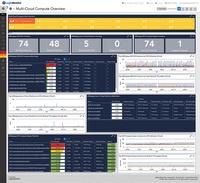
Screenshot of AIOps features for enterprises using technology or hybrid environments with cloud and container resources. LogicMonitor can be used to monitor and improve the performance of complex enterprise networks with dynamic thresholds, topology mapping, anomaly detection, and root cause analysis.Screenshot of LM Envision's comprehensive monitoring and observability capabilities across the IT infrastructure, that help to identify alerts for the most important systems while ensuring the user experience is uninterrupted across the globe.Screenshot of Monitoring that ensures servers and the applications running on top of them are highly available. Helps resolve issues and optimize resource consumption for the server infrastructure.Screenshot of LogicMonitor remote workforce monitoring, which ensures that employees are connected to the systems that keep them productive and provide proactive insight into dispersed systems and third-party outages.Screenshot of Unified cloud monitoring across a hybrid multi-cloud ecosystem.Screenshot of LM Logs delivering log analysis at enterprise scale.

LogicMonitor Videos

LogicMonitor helps Abrigo maintain 99.99% uptime
GCISD accelerates digital transformation with LogicMonitor
who is LogicMonitor?
Carrier partners with LogicMonitor in path to unified observability

LogicMonitor Technical Details

Deployment TypesSoftware as a Service (SaaS), Cloud, or Web-Based
Operating SystemsUnspecified
Mobile ApplicationApple iOS, Android, Windows Phone, Mobile Web

Frequently Asked Questions

LogicMonitor provides an agentless SaaS-based monitoring platform. LogicMonitor provides prebuilt integrations and an open API, and is designed to provide monitoring across networks, servers, applications, websites, and containers, including insights and reporting capabilities.

Datadog, PRTG Network Monitor, and Dynatrace are common alternatives for LogicMonitor.

Reviewers rate Support Rating highest, with a score of 9.

The most common users of LogicMonitor are from Mid-sized Companies (51-1,000 employees).

LogicMonitor Customer Size Distribution

Consumers0%
Small Businesses (1-50 employees)29%
Mid-Size Companies (51-500 employees)41%
Enterprises (more than 500 employees)30%
Return to navigation

Comparisons

View all alternatives
Return to navigation

Reviews and Ratings

(311)

Attribute Ratings

Reviews

(101-125 of 163)
Companies can't remove reviews or game the system. Here's why
December 14, 2020

Ease of use

Score 10 out of 10
Vetted Review
Verified User
Incentivized
[LogicMonitor] is our unified infrastructure monitoring tool, before we had [LogicMonitor] there were multiple monitoring tools sending signals where our SRT folks have to spend some time log in each tool to gather more data, making LM as one unified Infra monitor tool has reduced MTTR, This also reduced our administrative over head as this is a SAAS platform.
  • Infrastructure monitoring out of the box
  • Good integration with ITOM module of ServiceNow
  • Easy Learning curve, and ease of use.
  • Synthetic transaction monitoring
  • Application performance monitoring.
  • Fedramp certification.
[LogicMonitor] is a awesome infrastructure monitoring tool, it support's various tools and technologies out of the box which is a huge plus. Since this is a SAAS platform this has greatly reduced our administrative overhead and helped us concentrate on bringing in various metrics from different devices and applications which is a good thing.
Score 9 out of 10
Vetted Review
ResellerIncentivized
We currently use LogicMonitor to monitor every device we work on. We use it accross the entire organization in order to make sure that everything in one place. In terms of business needs it addresses, we were on another monitoring platform and moved over here due to the much easier onboarding process, ease of use, and the SAAS GUI that is not managed by us.
  • Monitoring
  • Configuration backups
  • Alerting
  • Folder structure
  • Collector stability
  • Additional integrations
In our case, we were able to use LogicMonitor to make our monitoring much easier. We now have much more insight over traditional SNMP only monitoring systems.

In some cases we attempted to monitor some custom scripts that did not suit us as well for our specific use case, but that was merely an ancillary feature that would be nice but in no way a deal breaker.
Collin Thoman | TrustRadius Reviewer
Score 10 out of 10
Vetted Review
Verified User
Incentivized
We use LogicMonitor solely within our IT department currently. However, we are exploring creating limited status dashboards for other departments to see the high-level status of our systems. We implemented LogicMonitor to gather more information regarding our servers and appliances with far less configuration compared to previous laborious and custom solutions.
  • Auto discovery of Datasources and Datapoints for every added device
  • Custom visual dashboards and many pre-configured rich dashboards
  • Broad support and continual expansion of new devices and manufacturers
  • After-hours alert management is lacking. 3rd party solutions are still recommended
  • Updating DataSources can be time consuming if you need to edit the original DataSource.
LogicMonitor is well suited for any size organization that wants to not have to "worry" about what to configure when choosing to monitor an environment. LogicMonitor auto finds and associates the DataSources and other types of data with the devices you add to LogicMonitor. We monitor primarily Windows servers in a VMware environment with no in-house custom apps. LMLogs has just been introduced and we have not used it. Prior to that I would have said LogicMonitor may not be appropriate for log monitoring.
December 11, 2020

Fantastically Awesome

Score 8 out of 10
Vetted Review
Verified User
Incentivized
It is being used in order to monitor the status of our servers. When we have a lot of end-users that are bombarding the system before a student call closes, we are on high alert, specifically watching Logic Monitor to see which servers are impacted and where we may need to add resources to manage the high demand. We also use it for testing purposes to see if our improvements have made an impact through the analysis of Logic Monitor.
  • Easy to use
  • Graphs are very informative.
  • Server specifics are also very informative (CPU, memory disk usage, etc.).
  • Anaylsis of data from months ago can be a challenge.
  • Organization of servers could be more user friendly.
  • Front end changes.
I would highly recommend Logic Monitor to be widely used by any of my colleagues, as it gives valuable information about systems that may not show any issues without it. Logic Monitor provides our company with the necessary information for us to improve our infrastructure so that we are better suited to serve the people we wish to.
Score 10 out of 10
Vetted Review
Verified User
Incentivized
We use LogicMonitor as our infrastructure monitoring platform across our 7 plants, 7 logistics facilities, 50 remote sites, and AWS/Azure hybrid cloud environments. LogicMonitor gives us a single pane of glass to view all of our infrastructures; from legacy hardware to bleeding-edge cloud resources. LogicMonitor also provides excellent default thresholds and alerting behavior, giving us huge gains in time for resolution compared to our previous toolset.
  • Cloud native service monitoring: Easy to setup and just works. Any service, any public cloud.
  • Legacy hardware monitoring: Just as good at monitoring that 25-year-old ERP HP-UX system as the latest cloud-native tool, all in one pane of glass.
  • Redundant collectors out of the box allow us to perform maintenance and not lose monitoring insight.
  • Support is outstanding. Just top notch.
  • The UI is not always consistent, particularly the enforcement of the 'better' alerts pane.
  • Spend even more time on your 'troubleshooter' data sources to identify monitoring collection issues; granted this has come a long way in the last year.
  • SSO integration using AD groups is not easy, requires custom integration work.
Well suited for orgs using a hybrid cloud model. Really shines in the 100-5000 device realm. Too expensive for smaller shops. Fully documented API allows for custom integrations with CMDB or external ticketing tools, which makes IT management much easier. Customizable data sources allow you to collect any arbitrary metric and action appropriately. This has business use.
Jason Neton | TrustRadius Reviewer
Score 9 out of 10
Vetted Review
Verified User
Incentivized
LogicMonitor is used by our Client Services and Support department for our managed services programs. We use it for proactive monitoring of critical application platforms as well as internal networks. By providing managed services, we employ LogicMonitor to watch all of the critical processes, services, and functions of an application in a client's environment. LogicMonitor being cloud-based and full-featured is crucial to our program not only for monitoring the technical applications, but also for it's impressive alerting architecture with different types of communication alerts for our on-call engineers.
  • Flexible so that you can easily define the service, application, process or any other critical function that is essential to successful operation. Works with so many different types of systems
  • Robust alerting mechanism and easy configuration and setup. Allowing for phone, SMS, and email alerting.
  • Has technology for watching almost any part of a technical environment. Great network hooks and tools, as well as configurable for most applications. Also, some really great new ways to monitor and deal with logs.
  • Easy to use interface for configuration and ongoing use.
  • Can always be more improvements in predictive monitoring and trending. Perhaps employing AI for some of the trending decision needs.
  • Reconsidering pricing on the entry-level side so that smaller organizations can get into these sophisticated tools more easily.
  • Possible pre-baked integrations with cloud platforms and services would be very nice.
LogicMonitor has been fantastic for monitoring premise applications and networks as one has access to all of the data and monitoring points easily. However, with the advent of cloud applications, would love to see potentially something that can monitor network connectivity to cloud services. Also, since browser performance is so critical to success with cloud applications, would be nice to see some hooks to individual workstations and browsers that could help identify issues to end users now that everyone is working from home.
Score 6 out of 10
Vetted Review
Verified User
Incentivized
We utilize it for our data center and cloud environments including network, server, virtualization, storage and facilities.
  • Alerting
  • Alert interface
  • Comprehensive
  • Reporting is poor
  • Setup interface is not intuitive
  • Expensive
You can cover many different monitoring requirements with one tool so it helps prevent application sprawl.
Score 9 out of 10
Vetted Review
Verified User
Incentivized
LogicMonitor is being used by our datacenter team as well as network teams. We use LogicMonitor to address gaps in our tools and gain visibility that we didn't have before. We are able to solve bandwidth/network issues much faster and quicker through the data that LogicMonitor sits and gathers. We are also able to then use the historical data and use that for planned growth, etc.
  • Great detail into systems that other vendors said couldn't be achieved
  • Ability to generate useful reports!
  • Portal is very easy to use
  • Ability to tweak alerting globally or individually is a big perk!
  • More pre-built dashboards would be nice
  • Dashboards can be confusing to configure
  • Alerts can cause fatigue if not properly tuned
LogicMonitor is perfect for monitoring network equipment especially if you have more than 1 environment split across other locations. It also provides fantastic insight into VMware products that were difficult to extract previously. The ability to go back and look historically at alerts and performance has been very beneficial. Overall a great product!
Score 9 out of 10
Vetted Review
Verified User
Incentivized
It was deployed by the IT Infrastructure department and is now being expanded to application support teams and other specialized groups. We have deployed it extensively to monitor physical and virtual servers, critical workstations, production services, all network equipment, and some security appliances so far. We are now implementing it to monitor application servers and services, databases, and webservices for uptime and performance. I've also been able to leverage it to give me thorough visibility into my SDWAN performance.
  • Alert rules
  • Performance monitoring
  • Escalation chains
  • Netflow monitoring
  • API integrations such as Meraki
  • Network mapping
I recommend LogicMonitor for ease of implementation and the simplicity to maintain the tool and database. Since the console is hosted in the cloud it was straightforward to stand up and add collectors inside our network. It doesn't have all possible features developed at this point but if you are looking for a good tool with a great team behind it to grow with your monitoring needs LogicMonitor is a solid option that is easy to use.
Score 8 out of 10
Vetted Review
Verified User
Incentivized
We use LogicMonitor to monitor servers and networks across multiple sites and servers to alert us of hardware issues or outages.
  • Can monitor O365 service status and throughput.
  • Able to predict future disk usage growth and alert us before we run out.
  • Very flexible in how we can handle and route alerting from issues.
  • Needs to implement device dependencies. For example not alerting on "down" devices attached to a switch that is down.
  • Does not handle clustered services very well. For example of a clustered VM goes offline and there are 4 hosts in the cluster all 4 hosts report and issue rather than the 1 host it resides on or just the guest machine itself.
  • Configuration can be confusing and difficult at times. The good news is their support is very available and willing to help.
Works very well for monitoring systems once everything is configured correctly.
Score 9 out of 10
Vetted Review
Verified User
Incentivized
I resolved many problems with memory and CPU issue. We improved many changes before that alerts. LogicMonitor is the best monitoring system in the world. Also, we can start some services in our systems when they stuck or were down. We can fix many problems in our platform after our clients create a ticket in our Service Desk tool, we can work on the problems faster and more efficiently.
  • Fix performance issues.
  • Monitoring server health.
  • Monitoring services.
  • I need to see more tools like Splunk or something like that.
  • LogicMonitor needs to have more tools to make integrations with Power BI or Tableau.
  • The search in the alert dashboard causes confusion in our coworkers.
Our dashboards help us a lot in resolve our issues faster. Also, all types of the alerts can help all our company make important decisions to increase our efficiencies in our platform. LogicMonitor is our most useful tool in the company because we can fix many problems in our platform and have all our systems up and running for a long time. Our SLAs in LogicMonitor make a quick response for issues in our servers or services.
Score 6 out of 10
Vetted Review
Verified User
Incentivized
We are using LogicMonitor to monitor enterprise on premise resources and cloud resources and alerting for critical issues. We also use it for tracking trends within our systems. we combine the use of LM with alerting services for 24/7/365 alerting to increase our ability to maintain ultimate uptime.
  • Technical support.
  • Account management team.
  • Standard instance monitoring.
  • Cost of monitoring modern technologies like containers.
  • Ease of use/UI.
  • Out of box dashboards that allow you to drill in with ease.
It doesn't appear to future proof us from a cost perspective.
David Ward | TrustRadius Reviewer
Score 4 out of 10
Vetted Review
Verified User
Incentivized
Infrastructure monitoring. We have it deployed for our IT manufacturing systems deployed at plants, cloud and datacenter locations, and networking teams to replace SCOM. We like LogicMonitor for agentless server monitoring, its SaaS based, thresholds and its ability to autodiscover. We find LM lacking severely in website, network, and cloud monitoring, as well as automation as they are no longer supporting their ansible modules. When we first started with them, they had a marketing slide about PowerBi, that my manager was keenly interested in. It turned out that was not an actual feature and have since removed the graphic.
  • Server monitoring
  • Baselining performance
  • Simple alerting method
  • Easy to use interface
  • Forward thinking
  • They need to support automation like ansible, puppet, chef.
  • The collector agent is extremely insecure and they are making no effort to improve this design.
  • They only support a few collector sizes that are unable to keep up with number of devices we have.
  • They do not support load balancing collectors.
  • They are terrible at notifying when datapoints are dropped or missing.
  • They are not good at network equipment monitoring and aren't able to tell the difference between weighted BGP interfaces intelligently understanding traffic patterns.
  • They're ML story is a lie, its all based on what they call dynamic thresholds that don't really work at scale and still require manually configuring the settings.
  • They released LM Cloud but scoped its use case too narrow causing a really good feature to be blind to other possible uses of that feature.
  • It is WAY too easy for datapoints team to be messed with and broken.
LogicMonitor is great for small shops or MSPs. Their ability to autodiscover devices and datapoints is awesome. There is a measure of flexibility in LM's ability to monitor and for that reason we like to say, if it can be scripted, we can monitor it.

I wouldn't use it for monitoring websites, NPM, APM, or Configuration management. Its just not well-developed in these areas. Website monitoring doesn't support synthetic logins or transactions. They actually told us we had to write our own groovy code to do this. Why should we as a customer have to learn a new programming language to attempt to login to a website? Our networking team likes LM's ability to backup the config on the networking equipment globally, but there is no ability to push the config, which almost makes it pointless according to them. NPM with LM is like pulling hair, there is no consistency and the requirements we need to get to where it is stable is daunting where SolarWinds would work right off. LogicMonitor's ability to autodiscover data is another feature that is sorely undervalued. There is a great opportunity to capture specific equipment details that they do not do out of the box and also has to be scripted.
Score 10 out of 10
Vetted Review
Verified User
Incentivized
We use LogicMonitor for network and system monitoring. The information and data provided by the tool helps influence decisions across the company as well as with our customers. We do standard network and systems monitoring to address issues actively as well as proactively. LogicMonitor provides a platform to deal with customer infrastructure issues, as well as the ability to predict and notify of trends, so our other teams can proactively predict future issues and deal with them before they happen. The ability to customize reports and dashboards is key as an MSP, because we can present custom tailored dashboards to our customers on request.
  • Present data in an easily digestible way.
  • Open communication with account representative for things like bug reports and feature requests to further customize our experience.
  • Platform Integration with ticketing systems is very good out of the box, with support for custom integrations.
  • Anything that can be measured can be monitored in LogicMonitor.
  • New features are often lackluster on first deployment, but usually are patched within an expected timeframe.
  • Support tickets could be worked faster.
  • Out of the box data sources are sometimes irrelevant and need to be customized.
The best monitoring solution I have used compared to Solarwinds, Nimbus, HP SiteScope.
LogicMonitor is great for monitoring up/down status of network and system devices. The tool works great for anything we can throw at it, whether it be application/website/device monitoring. There are few scenarios where LogicMonitor is not the right choice as a monitoring platform; in fact I cannot think of any where LogicMonitor was the issue.
Score 10 out of 10
Vetted Review
Verified User
Incentivized
We are using LogicMonitor to monitor and alert on a wide range of devices across our organization. From Dell servers to Nokia routers, we have no issue with setting each device up to be monitored. LogicMonitor monitors these devices and alerts on a wide array of issues. It can also be setup to monitor before there is an issue. This allows us to not only be reactive but proactive as well.
  • Intuitive
  • Cloud-based
  • Scope
  • Importing mib files
  • Alert tuning
LogicMonitor is well suited for alerting on devices based of snmp data points. It currently is less suited for monitoring and reading syslogs, but they are working to rollout a new feature that would improve this. It is also useful for keeping config backups of many devices, via importing them through ssh.
December 10, 2020

Excellent Value for needs

Score 9 out of 10
Vetted Review
Verified User
Incentivized
It's being used in our IT department for monitoring/alerting of our global server and network infrastructure.
  • Easy implementation.
  • Well organized dashboard.
  • Good value for cost.
  • Their additional add-ons have been released recently.
  • Had to buy a SIEM for LogicMonitor to hook into.
Anyone looking for good value for solution.
Score 4 out of 10
Vetted Review
Verified User
Incentivized
LogicMonitor is being used in our datacenters to provide an in depth overview at a glance and also granular alerting to specific events within our environments.
  • Great granularity.
  • Robust monitoring for all types of devices.
  • Easy to understand dashboards.
  • On-boarding is cumbersome.
  • Steep learning curve compared to other products.
  • Ease of use is not even considered.
LogicMonitor is great for network monitoring, providing in depth reports on all aspects of a firewall.
Score 10 out of 10
Vetted Review
Verified User
Incentivized
We are a MSP and we utilize the product to monitor and alert us for both our customers as well as our internal network devices and servers. The application is integrated with our ticketing system and allows us to quickly respond to alerts. It also allows for two way communication between our ticketing system and Logic Monitor.
  • Monitors a wide variety of equipment.
  • Integrates with multiple platforms.
  • Allows you to monitor multiple devices in a single view to give you a better idea of overall application performance.
  • Needs a better integration with Connectwise CMDB.
  • Would love to see a focus on MSP centric applications such as IT Glue and BrightGauge.
  • Pricing is a little hard to swallow.
If you are using Auvik today you should switch to LogicMonitor, the pricing is about the same - actually cheaper if you are using Netflow from Auvik, and Logic Monitor provides so much more. If you don't need two-way communication with your ticketing system another solution may fit your needs.
Score 10 out of 10
Vetted Review
Verified User
Incentivized
LogicMonitor is being used across our IS department to monitor our infrastructure as well as our applications. It helps us address any issues that come up immediately and keeps our systems running as expected. It allows us to quickly see the health of our applications as well as our infrastructure at all times and helps us isolate issues when they do come up.
  • It allow us to monitor our traffic across our MPLS and DIA links.
  • It monitors our switch ports and alerts us to any issues with our uplinks as well as our access ports.
  • It alerted us to expiring certificates on our network equipment which allowed us to avoid downtime.
  • We are able to create custom monitoring to tailor the software to our particular needs.
  • We had issues with netflow working properly with our Cisco Nexus gear.
  • We have had issues with SNMPv3.
  • The ability to easily browse thru resources is a little clunky.
LogicMonitor is perfectly suited for smaller IT teams that are required to monitor larger deployments. It provides a single pane of glass that gives you pretty much any information needed to maintain and monitor infrastructure and applications.It's ease to use interface and the ease of customizing datapoints to monitor makes it extremely useful. The one area where we found lacking was Netflow.
Score 9 out of 10
Vetted Review
Verified User
Incentivized
We use LogicMonitor for data analysis, environmental performance metrics, SLA metrics/Reports in our hosting Private/Public Cloud Solutions.
  • The environment is very easy to configure.
  • LogicMonitor deployed wizards to automate adding new resources. This feature makes end user functionality so easy.
  • SLA Report features are customizable and very reliant on environment matrix.
  • AWS Services and features for monitoring.
  • AWS Services reporting metrics
  • Go-Live Feature. When moving resources from a test environment to a production environment, SLA Data should have a data purge option. This would provide clean numbers on the production environment metrics on reports. Rather then including the test environment SLA data in a Production environment.
The data provided by LogicMonitor as an application guarantees the simplest way of a possible resolution to most issues derived by any environment.
December 10, 2020

Great product

Score 7 out of 10
Vetted Review
Verified User
Incentivized
LogicMonitor is being used across the wider Operations team within the business, which allows more accurate monitoring of server infrastructure to ensure that no issues go unnoticed.

It covers the majority of all monitoring elements such as performance-related issues, services stopping, and starting which may lead to service disruption.

Overall I am impressed with it's functionality and capability.
  • Monitors memory alerts
  • Monitors CPU loads
  • Monitors Service Checks for business critical applications
  • Simplistic Main Dashboard
  • Subdirectories for clients made easier to access
The perfect scenario would be if a client called in reporting that they are experiencing performance issues on their server, LogicMonitor allows you to log onto the platform and check the device along with the sensors set up to check every element possible on the server.

This way, it gives clarity and assurance that the product is fit for purpose.
December 10, 2020

LogicMonitor review

Score 10 out of 10
Vetted Review
Verified User
Incentivized
We utilize LogicMonitor to monitor and support our cloud and internal systems as well clients networks, systems, web sites and cloud resources.
  • Easy Deployment
  • Dashboards
  • Nothing installed on systems monitored
  • Voice system monitoring
  • Application monitoring
  • Call center monitoring
LogicMonitor is best suited for infrastructure monitoring. It is less appropriate for application monitoring
December 10, 2020

Monitoring made easy

Score 10 out of 10
Vetted Review
Verified User
Incentivized
We utilize LogicMonitor to provide us real-time monitoring and alerting of our public-facing production ERP system, FTP, and Network. We are able to monitor Azure Cloud Services, Netflow data from our NexGen Firewalls, Website uptime, SQL Services, and trends as well as a variety of other tools.
  • Very easy GUI to understand and read.
  • Lots of great ready to use dashboards.
  • Easy integration with Azure.
  • Lots of great out of the box services, the SQL tools in particular are outstanding.
  • Enhancements to the product have been great while using it.
  • Mobile App is essentially non-existent other than being in the app store.
  • Possibly more templates that are very specific and then allow a picklist (easy checkboxes) of resources instead of typing in more resources or creating a new group.
I am very happy with the product and don't have many negative comments to relay to a potential customer. I recommend the product for monitoring your network and traffic. There are tools that may be more specific for a certain project but for the price point, you get what you need and much more. I would happily purchase again.
Score 10 out of 10
Vetted Review
Verified User
Incentivized
We use LogicMonitor across the whole IT dept. This includes teams from network, voice, servers, firewalls and applications. We have dashboards for all of them to quickly monitor their systems. It enables everyone to look at their own equipment from high level or dig into the individual metrics. Having the collectors distributed across the country is very useful. Each one monitors devices close to it and provides rapid notification when something goes wrong.
  • Distributed collectors
  • Web based admin/dashboards
  • Very diverse monitoring platforms
  • Root Cause Analysis
  • Auto Balanced Collector Group
  • Better report generation
I love having many collectors spread out all collecting data to send up to the cloud. Our previous platform was a single server in the data center. It was often overloaded and didn't notify us in a timely manor. The web based admin is great. Not having to install software to manage is great. Also being cloud based is great for checking alerts/devices when not at my desk. There is room for improvement with the RCA feature. Our old platform used to only send one notice when a site went down. With [LogicMonitor] the feature is not quite there yet to only tell me the router is down. Instead I get many emails that the router and all the gear behind it is down when we lose an mpls link.
Score 10 out of 10
Vetted Review
Verified User
Incentivized
As an MSP, LogicMonitor is foundational to our NOC processes and enables our service teams to be able to effectively triage issues and remediate. The broad spectrum of devices and platforms it can monitor makes it a no-brainer for organizations that provide IT services across a variety of verticals. I'm a huge fan!
  • Monitoring
  • Alerting
  • Proactive response
  • Configuration backups
  • Better documentation on APIs and integrations.
It's super easy to deploy and administer. Very granular and robust alerting!
Return to navigation